In order to contribute to the national and European economic debate, the Banque de France periodically publishes macroeconomic forecasts for France, constructed as part of the Eurosystem projection exercise and covering the current and two forthcoming years. Some of the publications also include an in-depth analysis of the results, along with focus articles on topics of interest.
- These interim projections were finalised amid considerable uncertainty following the outbreak of the conflict in the Middle East on 28 February. We therefore present several scenarios that are consistent with those of the Eurosystem. The baseline scenario is based on assumptions derived from the futures markets as at 11 March 2026; the surge in hydrocarbon prices should be only temporary, which would correspond to a relatively swift resolution to the conflict. Since then, the geopolitical situation has been highly unstable and energy prices have increased, while remaining extremely volatile. We therefore present two more adverse scenarios, with stronger and more lasting rises in hydrocarbon prices.
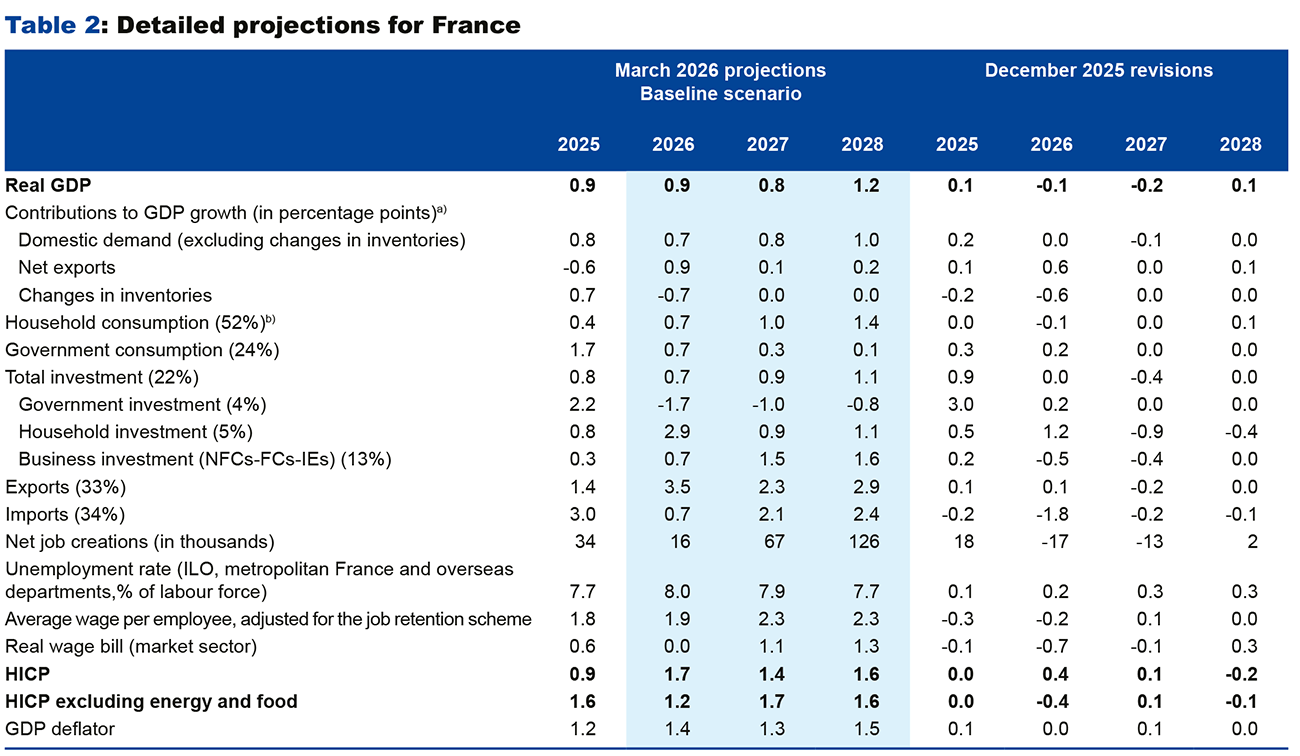
- In the baseline scenario, GDP growth is expected to come in at 0.9% in 2026. This figure is revised slightly downwards compared with our December projections. Economic activity proved to be more resilient than expected at the end of 2025, and is expected to remain so in the first quarter of 2026, based on the latest available business surveys, but the rise in energy prices and the deterioration in the geopolitical context are then likely to weigh on the French economy. GDP growth is forecast to be 0.8% in 2027 but is expected to pick up again in 2028, reaching 1.2%, driven by a rebound in exports and private domestic demand. In 2027 and 2028, domestic demand should be bolstered by household consumption, underpinned by the purchasing power of wages, and by a recovery in business investment.
- Still in this baseline scenario, after averaging 0.9% in 2025, inflation is expected to rise to 1.7% in 2026, driven by energy prices. It should fall temporarily to 1.4% in 2027, against a backdrop of easing energy prices. It should rise again to 1.6% in 2028, as a result in particular of services inflation.
- Under both adverse scenarios – but without incorporating an appropriate monetary policy response – HICP (Harmonised Index of Consumer Prices) inflation would be revised sharply upwards in 2026: it would reach 3.3% under the severe scenario. Annual GDP growth in 2026 would be weaker but remain positive. Inflation would start to normalise and growth would start to pick up in 2027, albeit more slowly under the severe scenario, and this trend would be confirmed in 2028.

The baseline scenario for these projections is based on Eurosystem assumptions, for which the cut-off date is 11 March 2026 (see Table 1 in the Appendix). These assumptions are based on the trajectory of oil and gas futures prices at that date. These assumptions also underpin the baseline scenario of the Eurosystem’s forecasts for the euro area published on 19 March. According to these assumptions, the price of oil is expected to rise to USD 92 per barrel in the second quarter of 2026 before stabilising at around USD 70 from mid-2027. The price of gas should rise to EUR 51 per MWh in the second quarter of 2026, then drop to EUR 24/MWh at the end of 2028. As in the Eurosystem forecasts, we also present two more adverse scenarios, based on assumptions regarding hydrocarbon prices that depend on the scale and duration of the conflict in the Middle East. Under the first adverse scenario, oil and gas prices would reach USD 119 per barrel and EUR 87 per MWh, respectively, in the second quarter of 2026, whilst under the severe scenario, oil and gas prices would reach USD 145 per barrel and EUR 106 per MWh, respectively, in the second quarter of 2026 and subsequently remain at higher levels over the long term (see Charts 1 and 2).


These projections also incorporate final HICP (Harmonised Index of Consumer Prices) inflation figures for February 2026, the Banque de France’s monthly business survey at the start of March and the detailed figures for the fourth quarter 2025 national accounts. The fiscal assumptions are based on the Budget Laws that were finally passed for 2026, which imply a smaller structural adjustment than in our December 2025 projections. We assume, however, that the positive macroeconomic effect of this lower fiscal consolidation is offset by a more wait-and-see attitude on the part of households and businesses. A number of downside and upside risks could affect the government budget balance in 2026 (implementation of the 2025 Budget, inflationary shock, etc.).
Under the baseline scenario, growth should be revised slightly downwards for 2026 and 2027 due to the geopolitical context
According to the latest quarterly national accounts, GDP grew by 0.9% in 2025, as forecast in our December projections. According to the Banque de France’s early March monthly business survey, GDP growth in the first quarter of 2026 is expected to be stronger than forecast in December, at between 0.2% and 0.3%. This positive surprise should, however, be offset over the whole of 2026 by the impact of the war in the Middle East on energy prices and the resulting rise in uncertainty. The geopolitical context is thus expected to weigh on household consumption, which should nevertheless witness positive growth in 2026, thanks in particular to a significant growth carry-over at the end of the first quarter of 2026, and on business investment, partly offset by lower imports. Overall, our GDP growth forecast for 2026 under the baseline scenario has therefore been revised slightly downwards from the previous forecast, to 0.9%.
In 2027 and 2028, GDP growth is projected to be 0.8% and 1.2% respectively, revised downwards by 0.2 percentage point and up by 0.1 percentage point compared with our previous projections. Rising energy prices, combined with an upward revision in interest rates compared with December, are expected to weigh on growth in 2027, while lower prices should allow for a recovery in 2028. Household consumption should remain the main driver of growth, fuelled in 2027 and 2028 by wage growth outpacing inflation and by the recovery in employment. Due to rising interest rates and uncertainty, the recovery in business investment is expected to be significantly less pronounced than in our December forecast. Household investment is also expected to be revised downwards. The contribution of foreign trade is expected to be slightly positive in 2027 and 2028, with an upward revision towards the end of the projection horizon, linked to more favourable assumptions regarding global demand and the effective exchange rate of the euro.


Inflation is expected to rise again in 2026 but should remain moderate under the baseline scenario
In 2026, headline inflation (HICP) is expected to rise again to an annual average of 1.7% under the baseline scenario, after standing at 0.9% in 2025 (see Chart 3). This rise is attributed to the sharp increase in hydrocarbon prices following the outbreak of war in the Middle East. Food inflation is also expected to rise, albeit to a lesser extent (to around 2%, after 1.5% in 2025), due to the impact of recent weather conditions on fresh produce prices and the rising cost of fertilizers and energy inputs. Meanwhile, inflation excluding energy and food is expected to fall to 1.2% in 2026 as a result of the past slowdown in nominal wages, which should be passed on to service prices, and of the past slowdown in import prices, which should hold down manufactured goods prices in the short term (see Chart 6). In 2027, energy prices are expected to fall in line with the technical assumptions regarding futures prices. As a result, inflation should drop to 1.4% on an annual average, despite the pass-through of the 2026 rises in oil and gas prices to food and industrial prices, as well as to wages and service prices. These second-round effects – albeit limited – should push inflation excluding energy and food back up to 1.7%. In 2028, inflation is expected to be 1.6%, driven in particular by service prices against a backdrop of a normalization of energy prices following their decline in 2027.
Compared with our latest projections, the headline inflation rate forecast for 2026 has been revised upwards by 0.4 percentage point under the baseline scenario, as the rise in energy prices more than offsets the downward revision to inflation excluding energy and food. This downward revision stems from the withdrawal of certain measures (such as the increase in medical deductibles) included in our previous forecast but not adopted in the Social Security Financing Act, as well as downward surprises in service prices in recent months. Headline inflation for 2027 has been revised very slightly upwards by 0.1 percentage point as a result of the delayed impact of the 2026 energy price rises on the non-energy components of inflation. Inflation for 2028 has been revised downwards by 0.2 percentage point due to a steeper downward trend in hydrocarbon prices on the futures markets, as well as to a downward revision of electricity futures prices compared to December, with the latter determining retail regulated prices for households.


Under the baseline scenario, the purchasing power of wages is expected to be stable in 2026, before picking up in 2027 and 2028
Based on the latest economic data (detailed fourth-quarter 2025 results, negotiated wage indicators), growth in the average nominal wage per employee has been revised downwards for 2025 and 2026, to 1.8% and 1.9% respectively. This downward revision, combined with rising inflation in 2026, is expected to result in stability of the purchasing power of wages for 2026.
However, growth in the average nominal wage per employee has been revised upwards by 0.1 percentage point for 2027, driven by the past rise in inflation, to stand at 2.3%, i.e. the same pace as in 2028. As in our previous projections, the average nominal wage per employee should therefore rise faster than prices in 2027 and 2028, which should contribute to an increase in the purchasing power of wages over this horizon and support household consumption.
As in our December projections, the unemployment rate is expected to rise at the start of the projection horizon, reaching 8.0% in mid-2026, before falling to 7.6% in the last quarter of 2028. It has been revised upwards over the projection horizon to take account of a higher-than-expected unemployment rate in the final quarter of 2025 and a weaker increase in economic activity.


Under both adverse scenarios, inflation would rise significantly more in 2026 and growth would be weaker
Given the high level of uncertainty surrounding the direct and indirect consequences of the conflict in the Middle East, we present, in addition to the baseline scenario, two more adverse alternative scenarios, using the same assumptions as those used by the European Central Bank for the entire euro area.
These scenarios differ from the assumptions used for the baseline scenario in three respects: the initial scale and duration of the shock to energy prices (see Charts 1 and 2 above), the level of uncertainty, and the magnitude of indirect and second-round effects on prices and wages. Thus:
- The adverse scenario assumes that flows of oil and liquefied natural gas (LNG) passing through the Strait of Hormuz will fall by 40% in the second quarter of 2026, without any major damage being caused elsewhere to existing energy infrastructures. The short-term rise in energy prices would be sharper than under the baseline scenario, as would the level of uncertainty in financial markets. However, oil and LNG production and exports from the Middle East would recover rapidly once the conflict ends, and prices would begin to gradually return to the baseline scenario level, which they would reach by the end of 2027.
- The severe scenario assumes that 60% of oil and LNG flows passing through the Strait will come to a halt in the second quarter and that existing infrastructures would be permanently damaged. Oil and gas prices would rise even further and remain consistently higher than under the baseline scenario despite a slow decline. Furthermore, uncertainty would reach levels that are consistently higher than under the adverse scenario.
- Under both scenarios, a shock to foreign demand for French goods has also been introduced to reflect the slowdown in economic activity among our trading partners. Finally, these scenarios also incorporate indirect effects on the prices of non-energy goods and services, as well as second-round effects on wages that are more pronounced than usual, in order to take account of a faster and more pronounced pass-through of energy shocks of a significant magnitude.
By convention, these scenarios assume that monetary and fiscal policies remain unchanged and that financial market expectations on future interest rates do not react. Furthermore, they do not incorporate other potential effects that are difficult to assess and measure, such as possible disruptions to global value chains due to supply constraints on inputs such as aluminium or sulphur, potential effects on the tourism sector, increased migration, etc.
Under both scenarios, HICP inflation would be higher than under the baseline scenario in 2026, up by 0.8 percentage point and 1.6 percentage point, respectively, under the adverse and severe scenarios. Due to a more lasting shock, it would also be higher in 2027 under the severe scenario (up by 0.3 percentage point) after reaching 3.3% in 2026. In 2028, the more pronounced fall in energy prices under the adverse scenarios (see Charts 1 and 2 above) would result in lower inflation than under the baseline scenario.
This inflationary shock, through purchasing power, would affect both household consumption and investment. The other shocks (uncertainty, international trade) occurring under the adverse scenarios would also have an impact on business investment and exports. Overall, annual GDP growth would be lower in 2026, by 0.3 percentage point and 0.6 percentage point, respectively, under the adverse and severe scenarios, compared with the baseline scenario, but it would remain positive. The impact on economic activity would be more lasting under the severe scenario, with growth still 0.4 percentage point lower than under the baseline scenario in 2027, however GDP growth would be stronger in 2028 than under the baseline scenario, due to a rebound effect (up 0.3 percentage point).

Box
Since the outbreak of the conflict in the Middle East, energy commodity prices have risen sharply, whilst the blockade of the Strait of Hormuz has raised fears of disruption to global supply chains. These events are reminiscent of those of 2022 and the start of the war in Ukraine, when trade was still hampered by production and transport difficulties resulting from the post-pandemic catch-up.
To what extent is the current shock comparable to that of 2022?
- As at 11 March, the scale of the shock to energy prices, particularly gas prices, anticipated by the markets was less severe than that observed in 2022 (see Chart), but this could change if the conflict proves to be more intense and protracted, as evidenced by the trend in oil and gas prices since 11 March.
- Like Russia in 2022, the countries of the Middle East are major energy suppliers to the European Union (EU). However, the EU was more dependent on Russian gas in 2022 (45% of EU gas imports in 20211), with very limited scope for substitution as it was supplied via pipelines. By contrast, gas from the Middle East (which accounts for around a quarter of global exports) is supplied in liquefied form to an integrated global market.
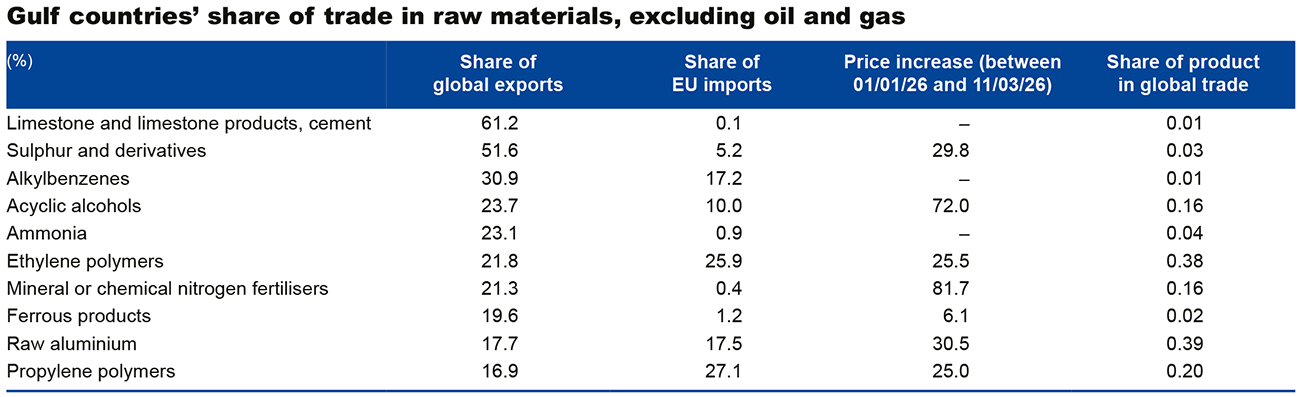
- This is compounded by an additional risk: the Gulf states are critical suppliers of certain key inputs (nitrogen fertilisers, sulphur, etc.), whose prices have risen sharply since the outbreak of the conflict (see Table below).
Nevertheless, this shock is occurring in a context that is, a priori, more favourable than in 2022, which may partially mitigate its effects, particularly in France:
- First and foremost, the shock linked to the current conflict in the Middle East is not compounding pre-existing inflationary pressures, as was the case in 2022, when the global economy reopened following the health crisis. Inflation in France stood at 4.2% in February 2022, compared with 1.1% in February 2026.
- Since 2022, the vulnerability of France and the euro area to a disruption in gas supply has been reduced, thanks in particular to new LNG import capacity from the United States, a structural decline in gas demand (of around 20%2) and an increase in the share of renewable energy in electricity generation. Furthermore, unlike today, electricity generation in France in 2022 was severely hampered by the shutdown of several nuclear power stations, which explains the rise in electricity prices in 2021, prior to the war in Ukraine. Since then, France has returned to being a net exporter of electricity. Given that interconnections with the rest of Europe are limited, it is unlikely that a rise in electricity prices in countries where electricity is generated by gas power plants will be passed on to French prices. When interconnections reach saturation point, France is effectively isolated from the rest of the European market, and a rise in gas prices no longer affects the French electricity market if the availability of its nuclear power stations is sufficient to meet demand.
- Finally, long-term inflation expectations appear to be more firmly anchored than in 2022, and markets are expecting rises in short-term interest rates to counter inflation, whereas in 2022 the initial market reaction was to expect a fall in rates due to risks to growth.
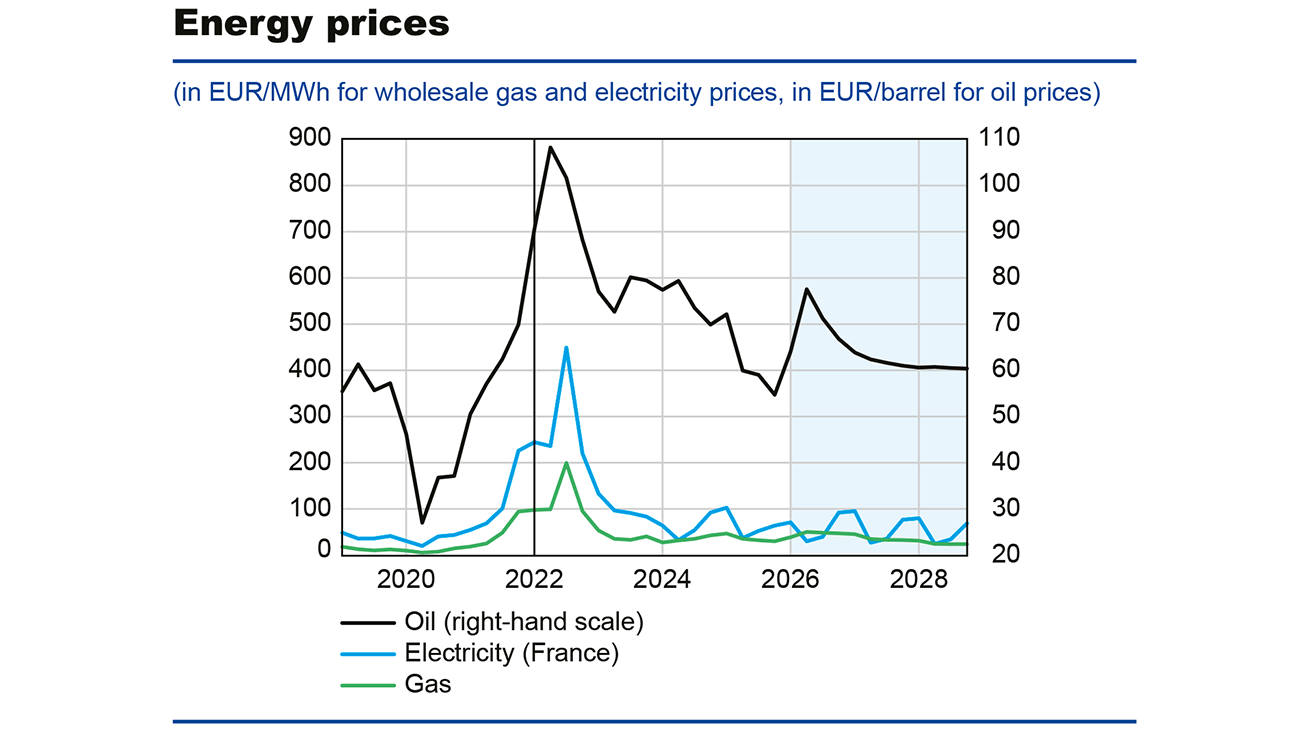
Sources: Eurosystem, data observed up to fourth quarter 2025. Blue-shaded area shows projections based futures contracts dated 11 March 2026
Note: The vertical bar corresponds to the first quarter of 2022, which marked the beginning of Russia's invasion of Ukraine.
Sources: CEPII (BACI database), except for price movements, which are sourced from Trading Economics.
Gulf countries: Bahrain, Kuwait, Oman, Qatar, Saudi Arabia, United Arab Emirates.
1 European Council of the European Union (2026), "Where does the EU's gas come from?", Explainers, March;
Eurostat (2026), "EU imports of energy products - latest developments", Statistics Explained, March.
Trade data by country are not sufficiently reliable, as some countries do not report their exports, or only partially, whilst physical data are not sufficiently detailed to allow for a comparison with the European Union or France.
2 Source Bruegel.
Appendix: Technical assumptions and detailed projections in the baseline scenario

Source: Eurosystem, Blue-shaded columns show Eurosystem projections.
Sources: INSEE data for 2025 (quarterly national accounts as at 27 February 2026). Blue shaded columns show Banque de France projections.
Download the full publication
Updated on the 26th of March 2026