Post No. 412. Inflation in the euro area reached its peak at 10.6% in October 2022 and receded quickly afterwards. Solidly anchored inflation expectations proved instrumental to this disinflation. But how can we gauge anchoring in practice? This blog post reviews various metrics to monitor the anchoring of inflation expectations in the euro area.
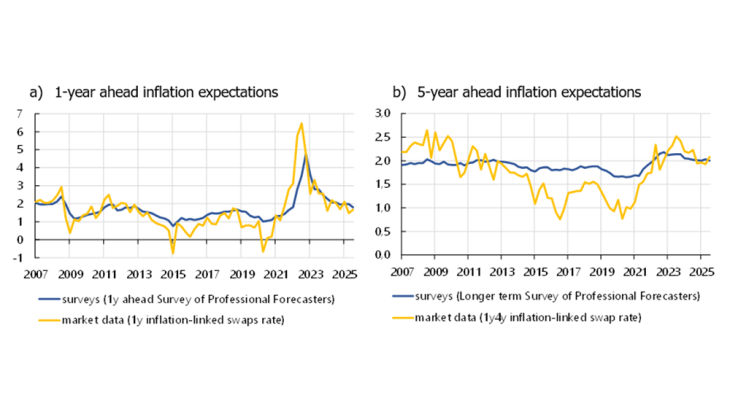
Chart 1. Comparison of measures of expectations from surveys vs. market data (%)

Note: Latest data at Q3 2025.
During the recent inflation surge, market inflation expectations increased but nowhere near the levels seen during the 1970s, despite the sharp rise in energy prices. Had expectations drifted significantly from the 2% target, as in the 1970s, then inflation would have been higher for longer (Dupraz and Marx 2025). Therefore, the anchoring of expectations has made disinflation less costly by reducing the interest rate hikes necessary to bring inflation down. This anchoring reflects the credibility built by the European Central Bank (ECB) over time through a sustained track record of low and stable inflation. Such credibility is therefore an asset to be preserved for the future and central bankers devote a lot of attention to monitoring expectations anchoring.
Measuring inflation expectation anchoring from market-based and survey-based data
Inflation expectations are not directly observed, but their level and evolution can be inferred either through market- or survey-based information (Chart 1).
Survey-based information includes data from different sources for the euro area, such as surveys addressed to professional forecasters (ECB survey of Professional Forecasters (SPF), Consensus Economics (CE), or the ECB Survey of Monetary Analysts) and to firms (e.g. Banque de France’s quarterly survey) and households (ECB Consumer Expectations Survey). Survey respondents are asked either to provide a point forecast for future inflation or to assign probabilities to pre-specified inflation intervals. Surveys are appealing as they can be interpreted directly, but they have two main limitations: they are infrequently updated and cover only a few time horizons.
Financial market products are a complementary source of high-frequency information, reflecting fast incoming economic news. The information is extracted from prices of products linked to inflation such as inflation-linked swaps (ILS) or break-even inflation rates. Their main advantages are their availability at a daily frequency and the fact that price formation at any point in time should reflect all the information available to investors for hedging their positions against inflation. But these inflation compensation rates do not only reflect financial market participants’ actual expectations, they also incorporate inflation risk premia. Therefore, they often need to be interpreted through the lens of models estimating the associated risk premia, or other key parameters.
How to assess the anchoring of inflation expectations?
The ECB targets an inflation rate at 2% over the medium term. Loosely speaking, inflation expectations are anchored if they remain stable around target in the medium to long run. In practice, the literature offers a variety of empirical approaches to gauge this stability. Using market-based expectations, one approach is to look how much they react to incoming macroeconomic news. In the same vein, one can estimate the sensitivity of long-term expectations to shifts in short-term ones. In both cases, little sensitivity to short-term information is interpreted as anchoring (Bernanke, 2007). Burban, De Backer and Vladu (2024) focus on the deviation of the average level of long-term expectations to the 2% target. Limited deviation is a sign of anchoring. Last, Grishchencko, Mouabbi and Renne (2019) propose a concept of anchoring that combines both the distance of inflation expectations to target and the uncertainty surrounding inflation expectations. The intuition is that a stable central tendency of expectations may hide wide disagreement or uncertainty, reflecting fragile and possibly weakly anchored expectations. Based on this battery of measures, how anchored are inflation expectations in the euro area?
Anchored inflation expectations in the euro area
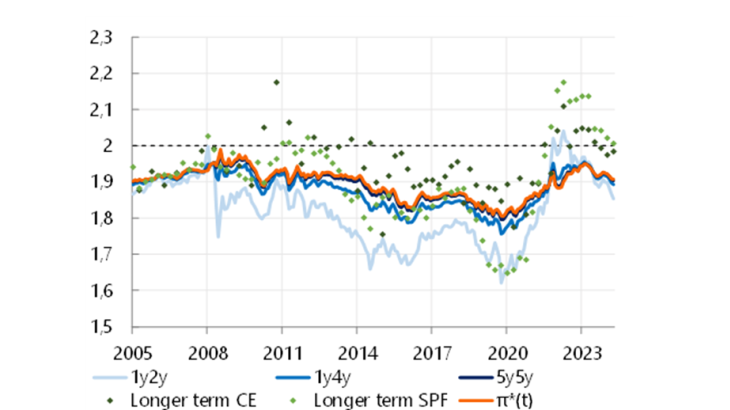
Using a model that encompasses both market-based and survey-based measures, Burban, De Backer and Vladu (2024) look at the expectations components of ILS – i.e. ILS rates corrected for risk premia– for various horizons. The novel feature of their model is that the infinite-horizon expected inflation rate (denoted ) can vary over time contrary to standard stationary models that feature a fixed endpoint where forecasts are assumed to converge at any point in time. Considering a medium-term horizon in line with the Eurosystem/ECB staff projections, they show that expectations of inflation two years ahead dropped as low as 1.6% in the midst of the COVID-19 pandemic (Chart 2). However, long-term inflation expectations (light and dark green dots) have remained relatively stable and well-anchored to the ECB’s inflation target since 2005.
Chart 2. Estimates of inflation expectations and survey data (%)

Notes: Expectations component from ILS rates at maturities 1y2y, 1y4y and 5y5y. 1yny reads as “expected year-on-year inflation rate n-year ahead”. Long-term CE refers to 6-10y horizon. Longer term SPF refers to 4/5y. Latest data at September 2024.
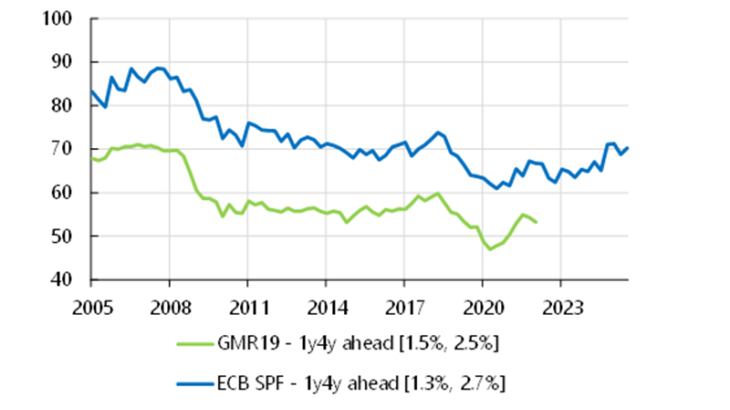
Grishchencko, Mouabbi and Renne (2019) complement this view with a measure of anchoring that accounts for inflation uncertainty. They rely on various survey forecasts and exploit the variation observed in the distribution of survey responses to compute the probability of inflation falling within the [1.5%, 2.5%] range –that is consistent with ECB’s target. Their analysis is extended in Chart 3 using SPF data (see blue line), for which the target range is broader due to data availability. Each measure indicates the probability that inflation 4-year ahead will be within a given range. The probability of expected inflation being in the [1.5%, 2.5%] range fell after 2009 in the euro area but remained above 50% until end of 2019. In 2020, this probability dropped below 50%, but subsequently recovered in 2021. More recently, the probability of expected inflation falling within the [1.3%, 2.7%] range has returned to pre-pandemic levels.
Chart3. Euro area measures of the anchoring of inflation expectations (probability as a % for expected inflation falling in different ranges at various horizons)

Note: Latest data at Q1 2022 for GMR19 and Q3 2025 for SPF [1.3%, 2.7%].
These two approaches convey consistent messages: a mild de-anchoring of medium-term expectations occurred in the euro area following the 2008 Great Recession but long-term ones remained solidly anchored. During the recent inflation surge, inflation expectations remained broadly anchored by historical standards. In current times of exceptional uncertainty, ECB President Lagarde (April 2025) stressed how critical the data-dependent and meeting-by-meeting approach is to determine the appropriate monetary policy. Employing a set of tools to gauge properly the risks to inflation and expectations anchoring is part of this agility.
Download the full publication
Updated on the 28th of October 2025