- Home
- Publications et statistiques
- Publications
- AI and banks' own funds: a new determina...
Post n°266. The increasing use of artificial intelligence (AI) or machine learning (ML) techniques could allow banks to develop new credit risk models. These techniques could lead to substantial reductions in capital requirements. However, the opaque nature of these algorithms and the governance challenges they raise might make their adoption less attractive.

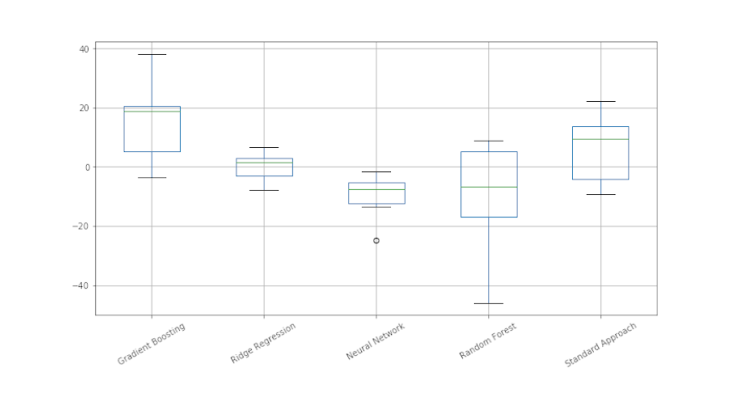
Notes: This chart shows the difference between the weighted risk densities calculated using the ML models and that calculated using a traditional IRB model. Each box represents the minimum (first black line), the first quartile (first blue line), the median (green line), the third quartile (second blue line) and the maximum (last black line) for the population of the 6 banks in the study. For example, out of the six banks considered, half of the banks have a density that is at least 7.5 basis points lower when using neural networks to model their credit risk than when using logistic regression (the traditional IRB model). The weighted risk density is the ratio of the weighted risks to the total exposures on which they are calculated. The capital requirements are calculated as a fixed fraction (8%) of the weighted risks.
When lending to a company, a bank has to meet regulatory capital requirements. These requirements are determined by internal risk models developed by the bank and validated by the supervisor (referred to as the "advanced approach" or "IRB" for "internal rating-based") or by external ratings of the companies to which the bank is exposed (referred to as the "standard approach"). Their calculation is central to a prudential arbitrage. If banks are capital constrained, higher capital requirements may limit lending and change loan allocations. However, higher capital requirements ensure that banks are more resilient to a systemic shock and thus increase their future ability to lend (see the BCBS publication for a review of the literature on the subject).
Credit risk is an area for which banks have access to long historical data. The capital and macroeconomic implications and the availability of data should therefore make the measurement of credit risk a key area of application for new ML techniques. The 2004 Basel II accords formalised the calculation of the Advanced Approach requirements. During the 2000s, some banks developed credit risk models ahead of this agreement. For French banks, many of these models were validated in the late 2000s at a time when ML techniques for modelling credit risk were either unknown or too computationally intensive to be implemented. Therefore, the validated models, still in use today, generally use simple and proven statistical methods (logistic regression).
In France, banks must report in a credit register managed by the Banque de France the outstanding loans they grant to companies if they exceed a certain threshold (EUR 25,000). Moreover, a large number of these companies are individually rated by the Banque de France (FIBEN reference). For example, the Banque de France uses the FIBEN rating to assess the quality of claims held by banks on companies that can be used as collateral when banks wish to access central bank refinancing. Companies' credit risk and exposure (default, failure) are therefore monitored by the Banque de France at a very granular level.
Drawing on this granular data, it was possible to build, for each of the major banks operating in France, corporate credit risk models using the various ML techniques most commonly employed (see Fraisse and Laporte, 2021). These credit risk models were developed subject to a number of statistical compliance tests, which are described in the manuals provided to banks by the supervisor (see the ECB's page on internal models where such guides are provided). Therefore, it was possible to develop for each ML technique and by taking as a reference the traditional risk modelling used in banks today:
- a measurement of changes in regulatory capital (see Chart 1)
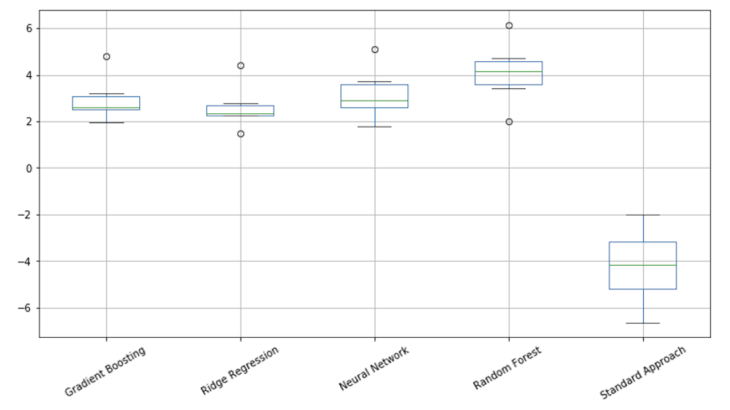
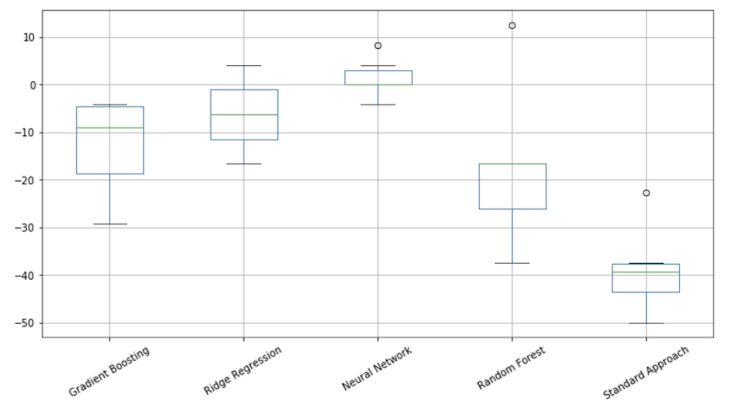
- compliance indicators regarding its predictive capacity (Chart 2) and the resulting risk differentiation (see Chart 3).
The models exhibit similar predictive capacities (see Chart 2). However, there are significant differences in their robustness. Neural networks and the traditional model offer the most stable rating systems with the best risk differentiation (see Chart 3). Lastly, neural networks are the only models that can generate a significant reduction in capital requirements compared to traditional modelling (see Chart 1). This reduction is due to the ability of this type of model to differentiate between risk exposures even when risks are low.
Can we therefore expect banks to completely overhaul their internal models?
Mastering ML techniques - which is part of the curriculum of freshly graduated statisticians or data scientists - makes it possible to re-estimate these models, since the skills and economic incentives are there. Yet, while the industry maintains that it uses ML models for lending, banks seem reluctant to use these techniques in the models developed for calculating capital, citing regulatory barriers (“Machine learning in credit risk – 2nd edition summary report” – IIF (2019)).
Regulatory impediments include the explainability of ML techniques - which are less transparent than traditional parametric techniques - while banking regulations require models to produce an intuitive measure of credit risk. Furthermore, when using models, banks have to use human judgement in addition to the analysis, which is more difficult to do with ML techniques and the result is hard to explain. The complexity of some ML techniques can also raise governance concerns as regulations require that a bank's senior management have a clear understanding of how the model is designed and how it works. The last difficulty is that some models using ML techniques are updated frequently, whereas the regulations require prior authorisation from the supervisor before any changes can be made to the model.
To further the debate, the European Banking Authority has therefore recently published a discussion paper (EBA, 2021) which proposes to explore in greater depth the issue of regulatory barriers to the use of ML techniques in IRB models by asking European institutions to comment on some key questions.

Notes: This chart compares the Area Under Curve "AUC" calculated with ML models and that calculated using a traditional model. The AUC is a common predictive capacity criterion that depends on the number of correctly predicted defaults and the number of wrongly predicted defaults. The AUC is a value between 0 and 100 (perfect predictive capacity). For more details see Fraisse and Laporte (2022, “Return on Investment on AI: The Case of Capital Requirement” forthcoming in the Journal of Banking and Finance). Each box represents the minimum (first black line), the first quartile (first blue line), the median (green line), the third quartile (second blue line) and the maximum (last black line) for the population of the 6 banks in the study.

Notes: This chart shows the difference in the robustness indicator of the rating system between the ML models and the traditional model. This indicator reflects the differences in the risk classes of the rating system. It varies between 0 and 100 (maximum risk class differentiation). See Fraisse and Laporte (2022) for more details. Each box represents the minimum (first black line), the first quartile (first blue line), the median (green line), the third quartile (second blue line) and the maximum (last black line) for the population of the 6 banks in the study.
Updated on the 25th of July 2024