In order to contribute to the national and European economic debate, the Banque de France periodically publishes macroeconomic forecasts for France, constructed as part of the Eurosystem projection exercise and covering the current and two forthcoming years. Some of the publications also include an in-depth analysis of the results, along with focus articles on topics of interest.
- These macroeconomic projections have been prepared in a highly uncertain international business environment, dominated by successive announcements concerning US tariffs. They were finalised on 21 May, on the assumption in the central scenario that tariffs would remain at their current level of 10% and that they would not be raised at the end of the 90-day suspension period ordered by the US administration.
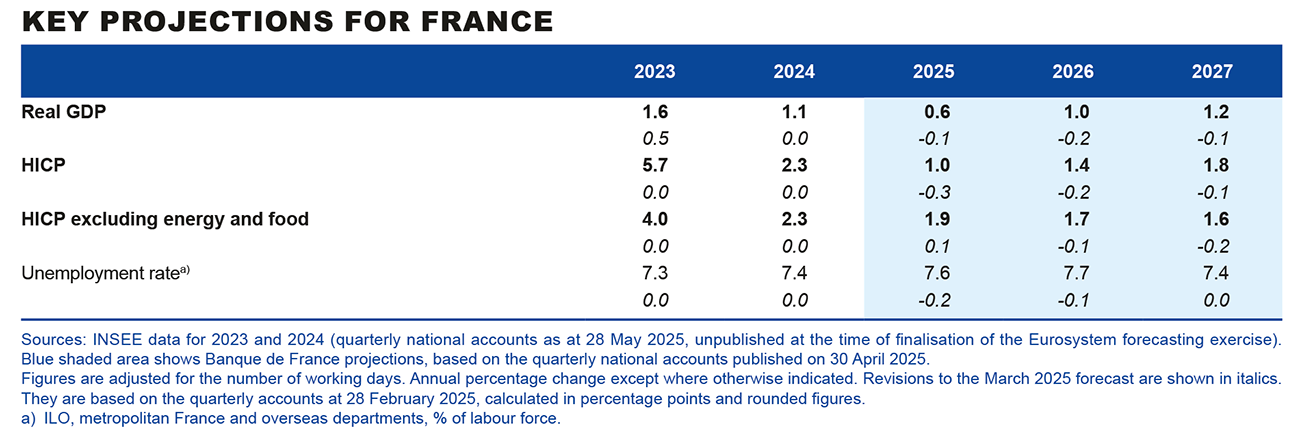
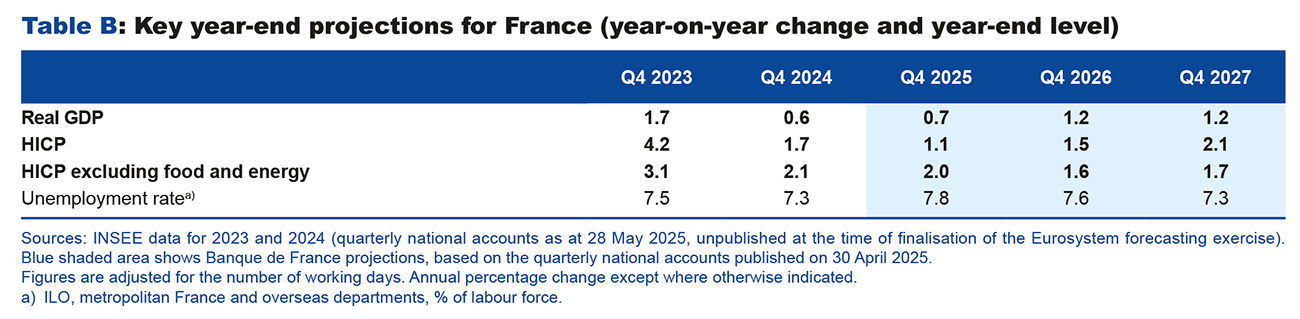
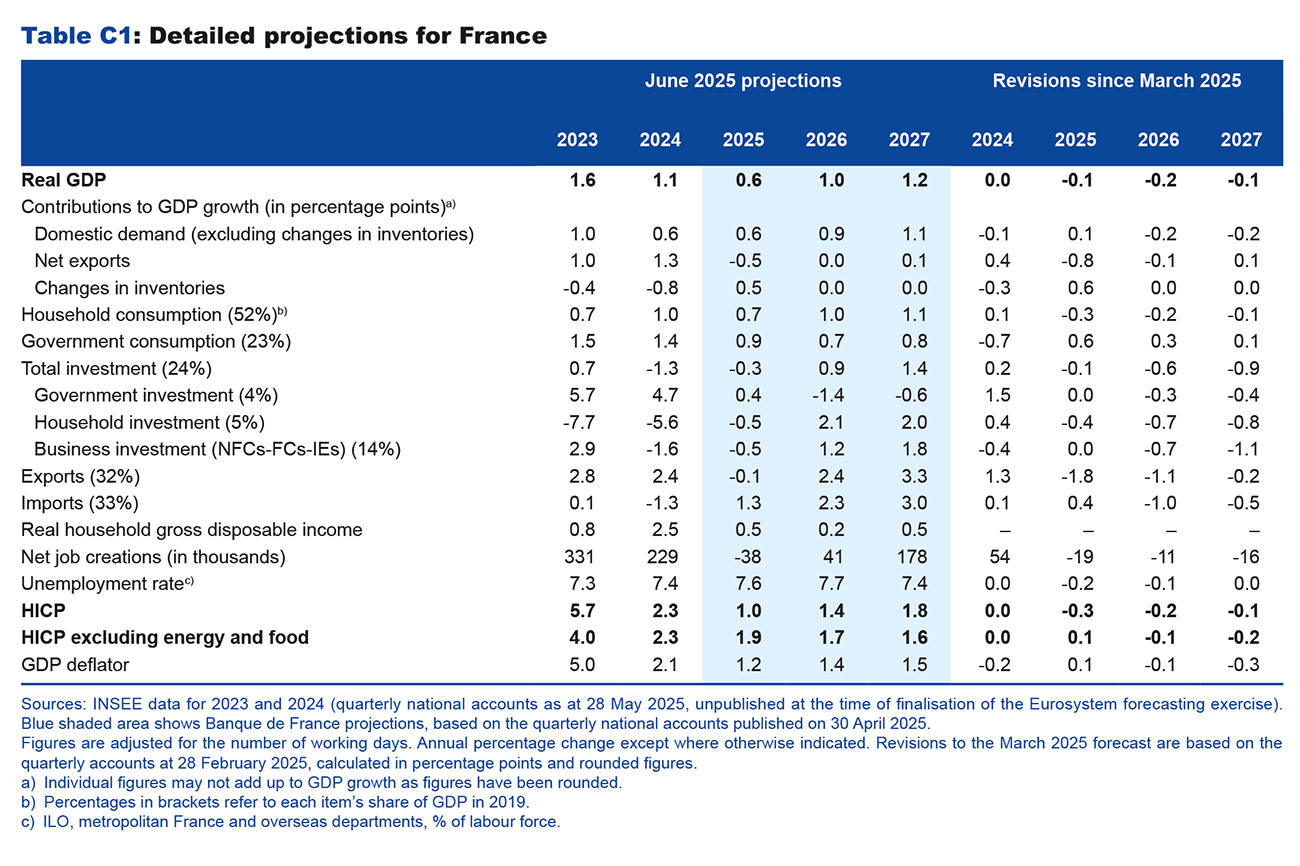
- After rising by 0.1% in the first quarter of 2025, GDP is expected to grow at a moderate pace in the first half of the year, before accelerating slightly in the second half of the year to an annual average of 0.6% in 2025 (after increasing by 1.1% in 2024). In 2025, activity should be buoyed by domestic demand, while foreign trade will weigh negatively on growth. Growth is expected to strengthen to 1.0% in 2026, and to 1.2% in 2027, as consumption and private investment recover, followed by exports.
- Employment should remain resilient, with a limited increase in the unemployment rate, combined with a smaller catch-up in past productivity losses. The financial situation of households (purchasing power) and businesses (margin rate) is expected to remain broadly sound, to the detriment of public finances.
- The outlook for consumer price inflation has been revised downwards. After 2.3% in 2024, headline inflation (HICP – Harmonised Index of Consumer Prices) is expected to flatline in 2025 at 1.0% due to a sharp decline in energy prices, while inflation excluding energy and food – including service prices – is expected to fall to 1.9%. The normalisation of energy prices is then expected to push headline inflation back up to 1.4% in 2026, and to 1.8% in 2027, still below the 2% threshold. Inflation excluding energy and food should continue to decline to 1.7% in 2026 and 1.6% in 2027, reflecting slower wage growth and exchange rate appreciation.
- Despite a reduction in the government deficit to below 5% of GDP in 2026 and in 2027, the public debt-to-GDP ratio is expected to continue rising towards 120% of GDP by the end of 2027 and to diverge from the euro area average.
- Uncertainty surrounding the growth forecast is generally on the downside, in a context dominated by a very high level of uncertainty over US trade policy.
Higher tariffs and uncertainty over trade negotiations are expected to weigh on GDP growth in 2025, before a recovery in 2026 and 2027
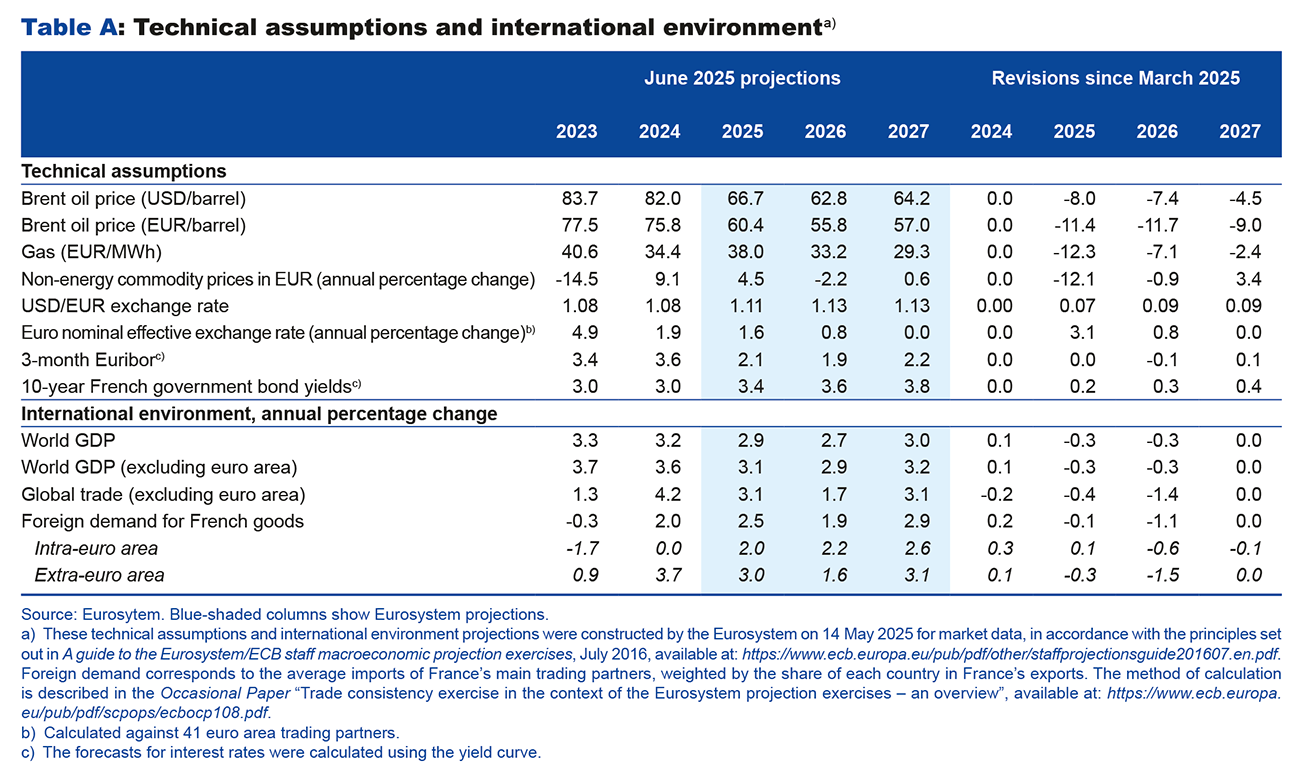
This projection, which was finalised on 21 May 2025, incorporates the first estimate of the first quarter 2025 national accounts published on 30 April, and the final estimate of HICP (Harmonised Index of Consumer Prices) inflation for April published on 15 May. It is based on Eurosystem technical assumptions, for which the cut-off date is 14 May 2025 (see Table A). It does not take into account the detailed figures for the first quarter of 2025. As was the case for our March 2025 interim projections, fiscal assumptions are based on the Budget Act for 2025, enacted on 14 February 2025, and on the 2025 Annual Progress Report, published on 16 April.
The international trade scenario is based on joint Eurosystem assumptions that US tariffs will remain at their current levels. It therefore includes so-called “reciprocal” US tariffs of 10% on European Union (EU) exports from the second quarter of 2025 until the end of the projection horizon, without any retaliatory measures by the European Union, as well as a series of sector-specific measures such as 25% tariffs on steel and cars. With regard to US-China trade relations, the projection assumes a 30% increase in US tariffs, with China applying equivalent tariffs on US exports. Lastly, it assumes that trade policy uncertainty (as measured by the Trade Policy Uncertainty Index) should gradually return to the level observed in 2018 when tariffs were raised. Box 1 provides more details on this scenario and on our estimate of the impact of trade tensions on French growth.
According to the detailed results of the quarterly accounts published on 28 May, after this projection was finalised, growth in the first quarter of 2025 should be confirmed at 0.1%. The growth carry-over for 2025 at the end of the first quarter of 2025 has been revised slightly downwards to 0.3%, compared with 0.4% in the quarterly accounts published on 30 April, on which this projection is based, but without calling into question our growth forecast for 2025. According to the Banque de France’s most recent business survey at the beginning of May, activity is expected to grow by 0.1% in the second quarter, following 0.1% growth in the first quarter of 2025.
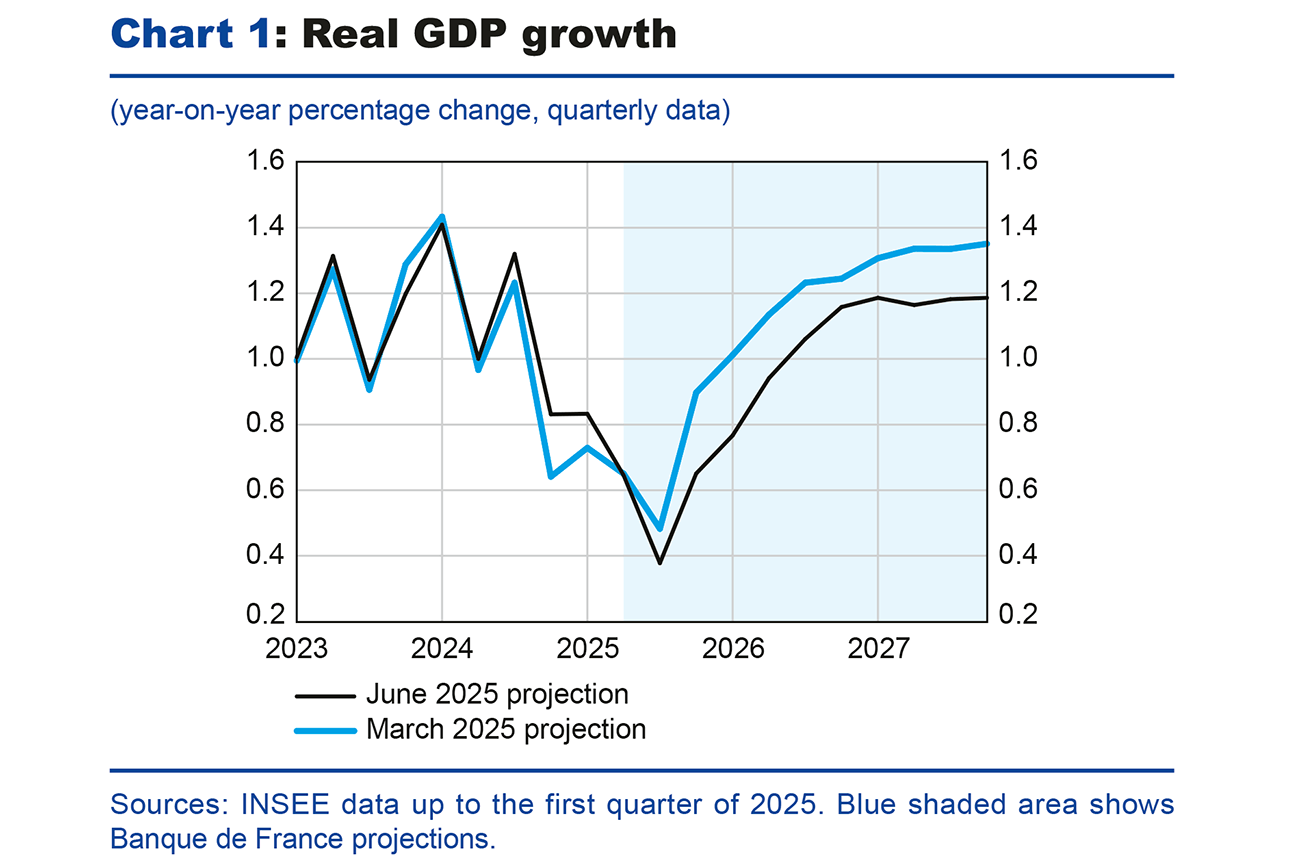
Compared with our March projections, real GDP growth has been revised downwards over the entire projection horizon (see Chart 1). Economic activity is expected to witness a slightly more marked slowdown in 2025, while the recovery in 2026 and 2027 is expected to be more gradual than in our previous projections. The cumulative revision amounts to a negative 0.4 percentage point impact on growth in 2025-27. This is mainly due to the effects of US trade policy, which contribute -0.2 percentage point (see Box 1). The assumption of a higher exchange rate also underpins this downward revision, while lower energy prices tend to mitigate it.
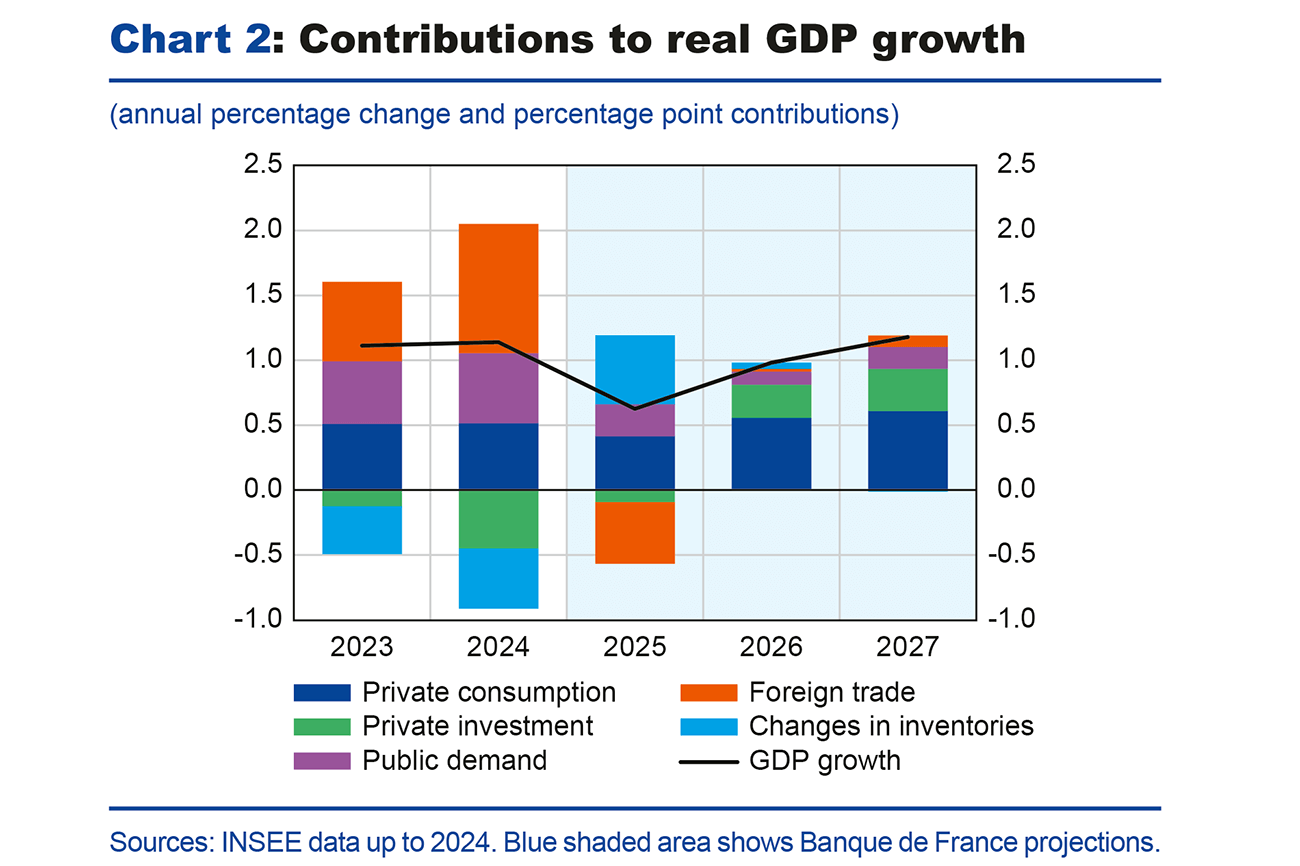
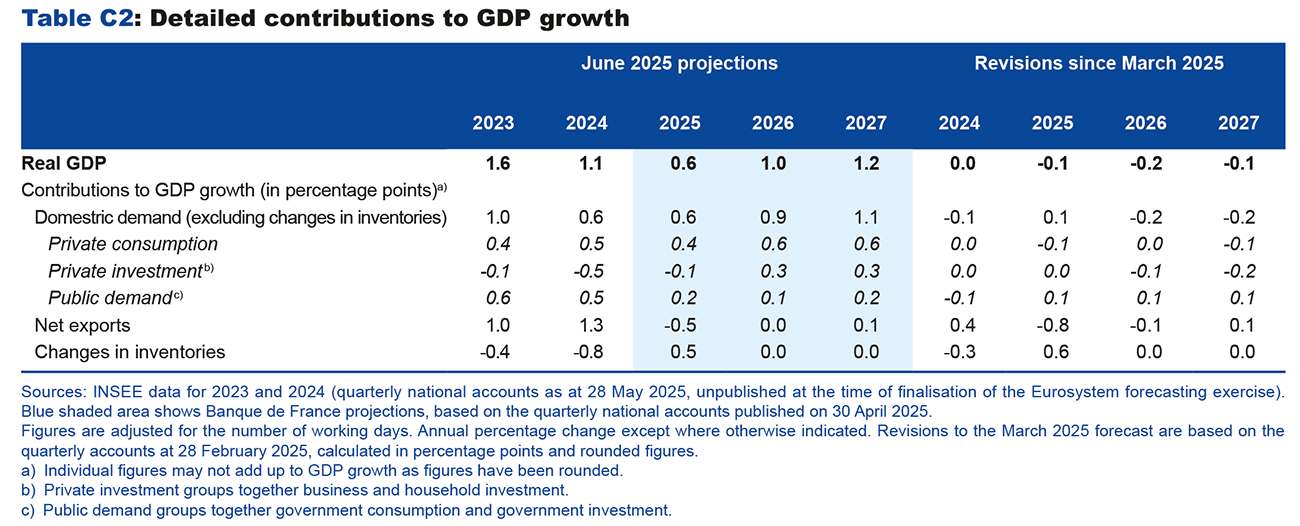
In 2025, GDP should grow at an average annual rate of 0.6% (compared with 0.7% in our March interim projections, see Chart 1). This limited revision of our growth projection masks fairly strong disparities between the various components of demand. Exports are expected to slow sharply due to the impact of higher US tariffs, lower demand from outside the euro area and exchange rate appreciation: the contribution of foreign trade to growth is expected to turn negative at -0.5 percentage point, a downward revision of 0.8 percentage point compared with our March projection. Domestic demand excluding inventories should be revised only slightly and its contribution to growth should remain positive in 2025 (at 0.6 percentage point), but with a change in its composition: the lower contribution from private demand should be offset by higher public demand. Lastly, changes in inventories should contribute positively to growth in 2025, in contrast to 2024. This contribution would result entirely from the significant rebuilding of inventories recorded in the first quarter of 2025, reflecting the negative contribution of foreign trade.
In 2026, annual GDP growth should come in at 1.0%, down 0.2 percentage point compared with our March projections. The deteriorating international environment should continue to weigh on foreign trade, whose contribution to growth is expected to be zero, down 0.1 percentage point compared with our March projection. Household consumption should grow at a slightly faster pace than in 2025, driven by higher real wages, which are expected to remain buoyant despite the fall in employment and a downward revision of average nominal wage growth. Private investment is expected to recover, but by less than we forecast in March, due to lower growth in 2025-26 and higher long-term interest rates (see Appendix A).
In 2027, annual growth is expected to be close to the potential growth rate, sustained by domestic demand and the beginning of an improvement in external trade, whose contribution to GDP should turn slightly positive, at 0.1 percentage point.
Inflation should remain below 2% for the foreseeable future
In May 2025, HICP inflation stood at 0.6% year-on-year, after 0.9% in April 2025. Core inflation (excluding energy and food) was 1.5% year-on-year in May 2025, after 1.9% in April 2025.
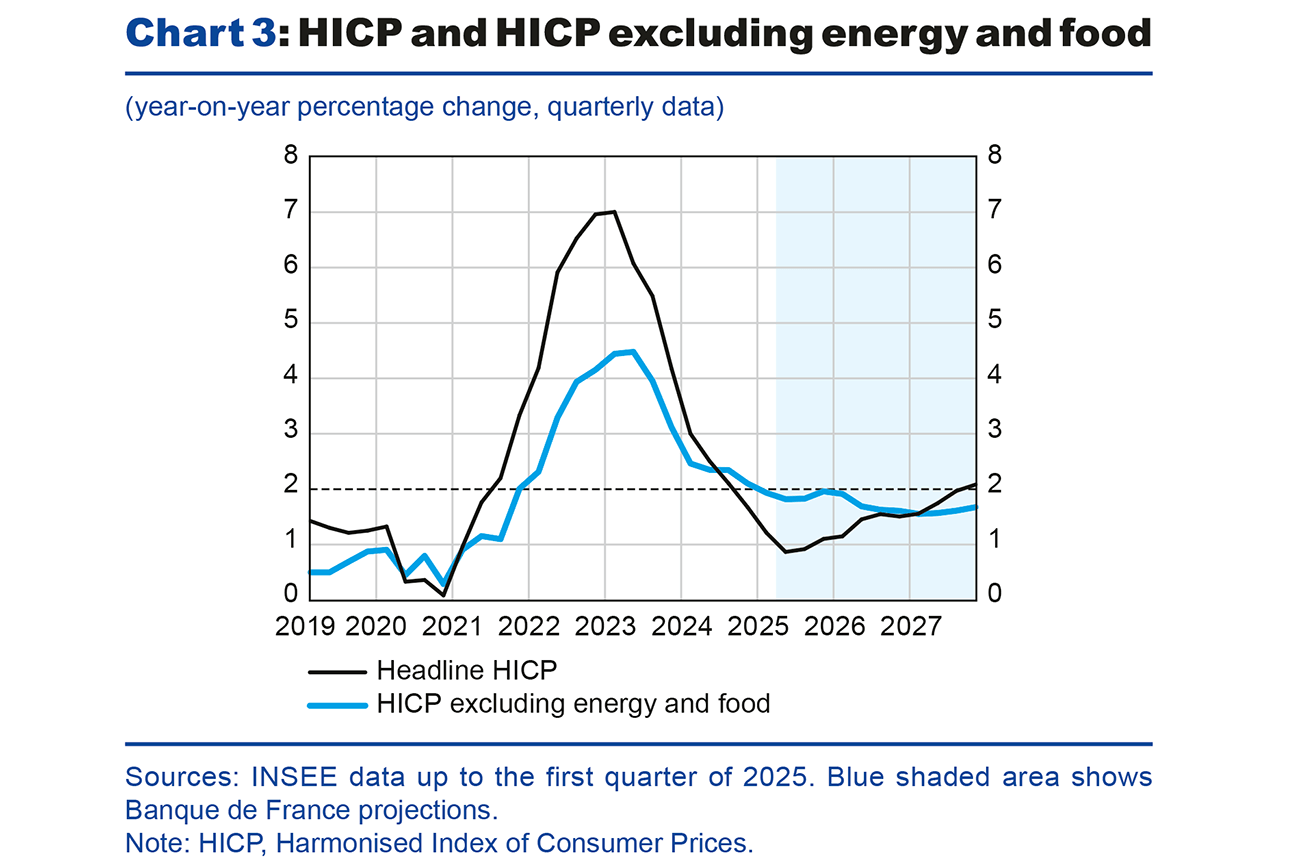
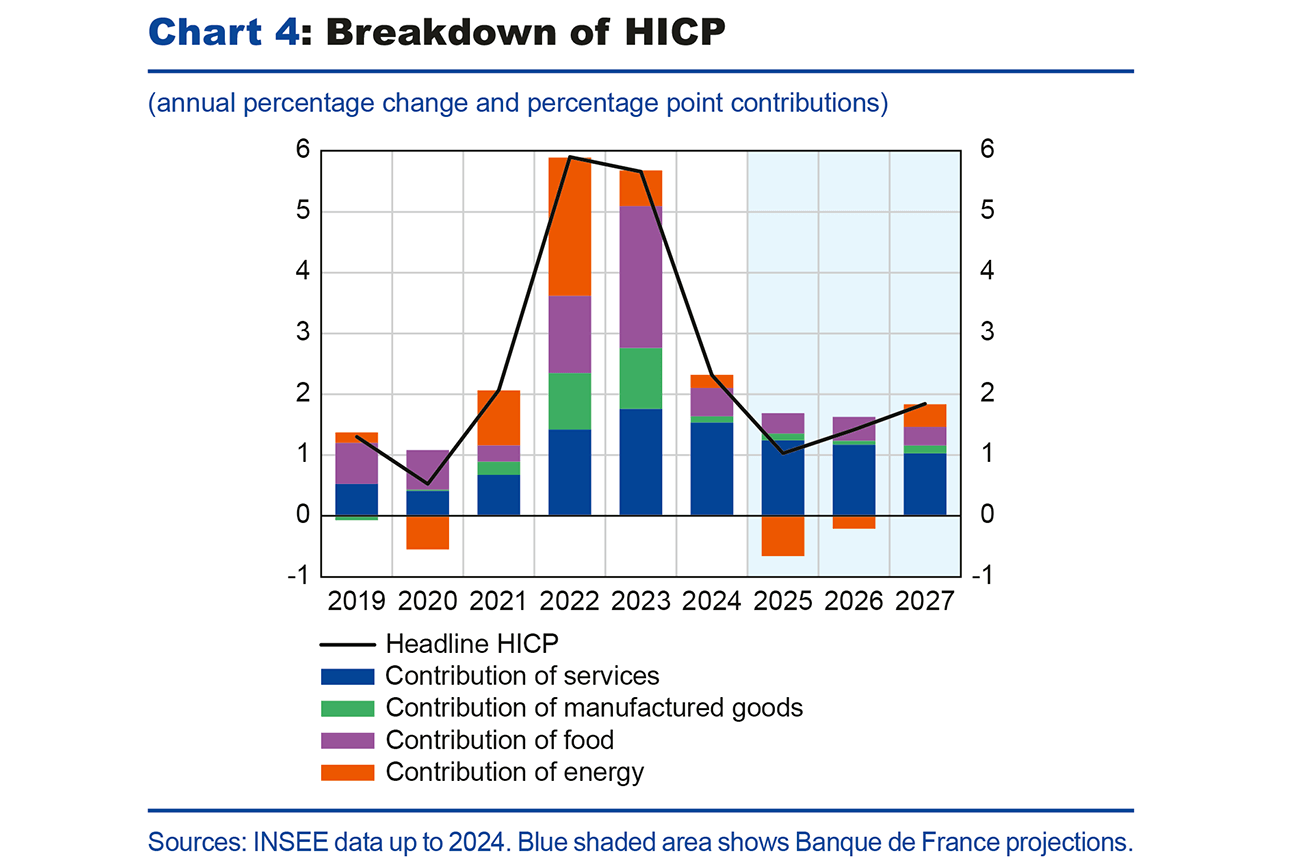
For 2025 as a whole, headline inflation is expected to average only 1.0%. This low rate is mainly attributable to a strong negative contribution from energy inflation throughout the year, following the reduction in regulated electricity prices at the beginning of the year and the more recent sharp drop in oil and gas prices. Conversely, food prices are expected to contribute increasingly to headline inflation throughout 2025, reflecting recent price increases resulting from trade negotiations between producers and large retailers, as well as past increases in certain raw materials (cocoa, coffee) that are likely to continue to be passed on to final prices. Inflation excluding energy and food should mainly be sustained by the contribution of services. This component should remain fairly inert despite the slowdown in wages since the beginning of the year, due in particular to recent price increases in healthcare, recreational and sports services. In the fourth quarter of 2025, headline inflation is forecast to be 1.1% year-on-year, and inflation excluding energy and food 2.0%.
In 2026, headline inflation and inflation excluding energy and food are expected to be 1.4% and 1.7% respectively. Prices of manufactured goods are likely to rise at a moderate pace because the recent appreciation of the exchange rate should feed through to consumer prices over this period. The past slowdown in nominal wages is expected to feed through to services prices, which should slow more markedly.
Finally, in 2027, headline inflation should come in at 1.8%, the same as in our March interim projections. Inflation excluding energy and food is expected to fall to 1.6%, as the slowdown in wages continues to feed through to services prices. Energy prices should rise over the year as a whole, due to the introduction of the second European carbon market (ETS-2), although the impact of the new emission quotas remains highly uncertain given the offsetting measures that may be introduced.
Inflation-adjusted wages are expected to grow, albeit at a slower rate than in our previous projections
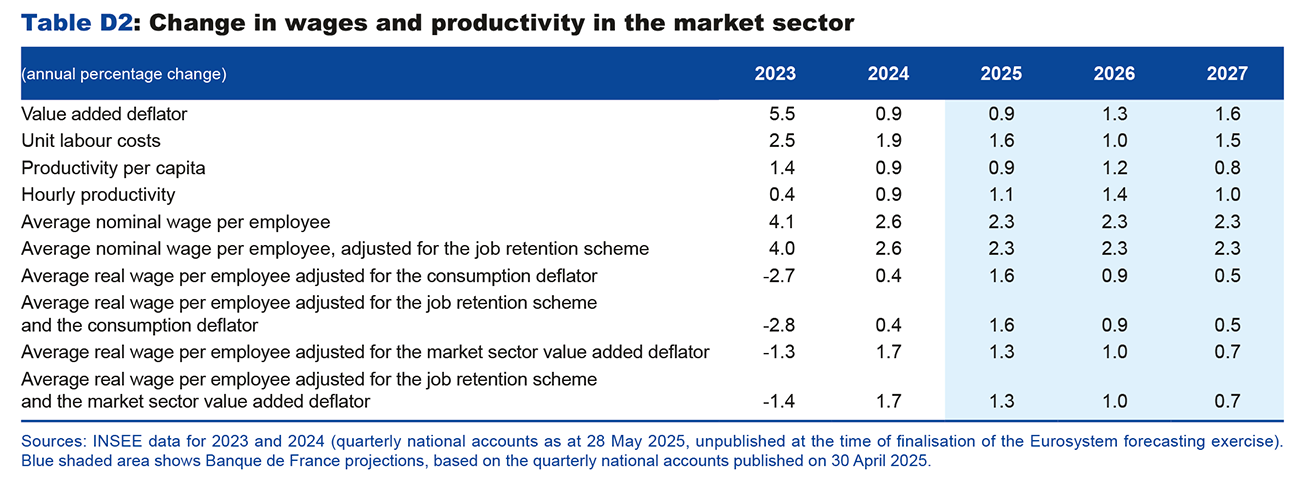
Our wage projection incorporates the latest data on the basic monthly wage, which is expected to grow by 2.1% year-on-year in the first quarter of 2025, as well as the latest assessment of the Banque de France indicator for negotiated wages, which should rise by 1.8% in first quarter of 2025.
Although average nominal wage per employee has slowed in the market sector since the second half of 2023, it has still risen faster than prices since the second quarter of 2024, a trend that is expected to continue across the projection horizon (see Chart 5). We therefore expect real market wages to return to their end-2021 level in 2027. However, since our March projections, the wage growth scenario has been revised downwards over the entire projection horizon for several reasons. First, monitoring of negotiated wage indicators highlights a faster-than-expected slowdown in wages, leading us to revise the short-term trajectory of the average wage per employee. Second, our revised assessment of productivity losses (see below and Box 3) leads to a significant downward revision of labour productivity growth in 2026-27, which would feed through to real wage growth. Finally, the impact on inflation of the more marked decline in energy prices implies less dynamic growth in both the national minimum wage and in nominal wages. Therefore, between 2025 and 2027, nominal wages are expected to grow by 2.3% a year.
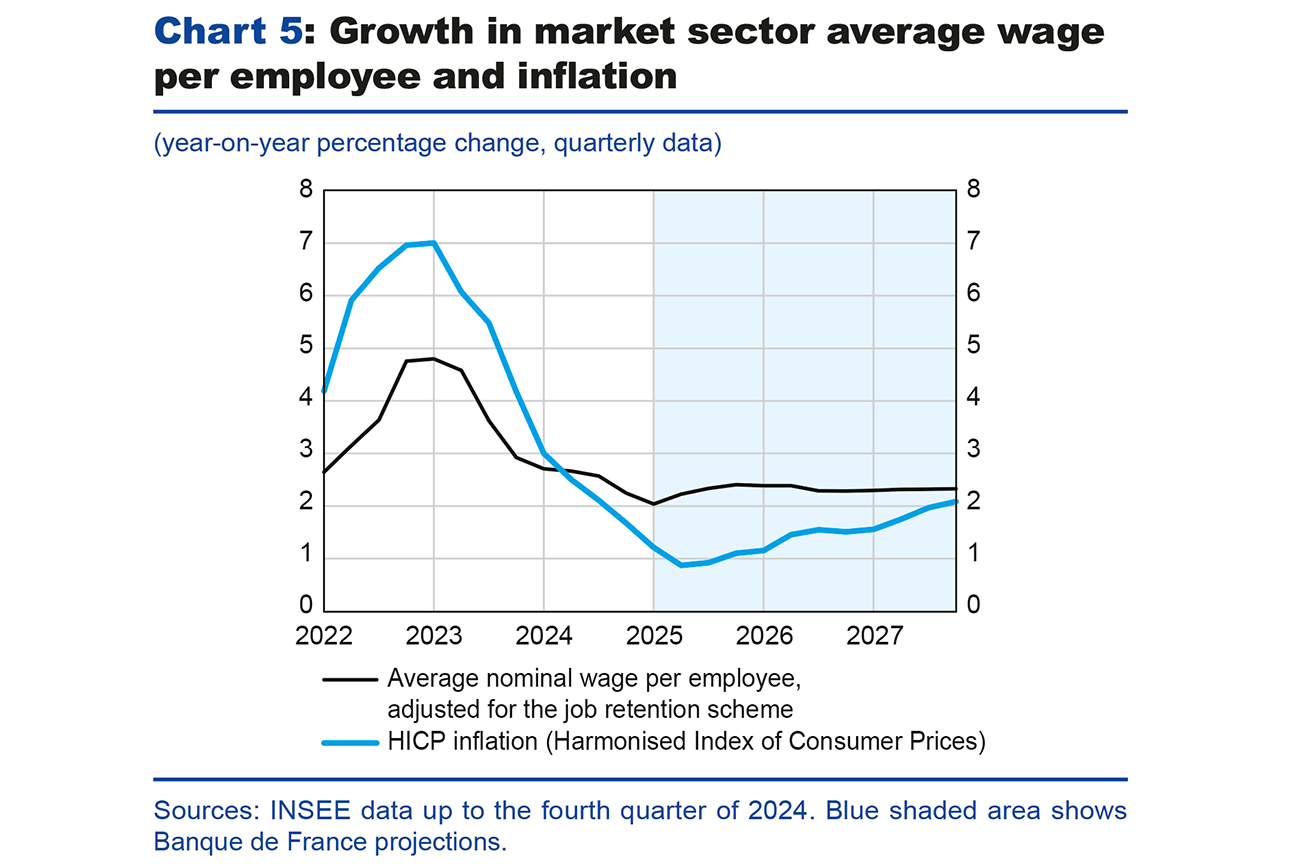
Over the entire projection horizon, nominal wages should rise faster than prices and sustain the purchasing power of wages, despite the decline in employment and the rise in the unemployment rate. Compared with our previous projections, real wages should be revised upwards in 2025 – due to a larger downward revision in prices than in wages – and then downwards in 2026 and 2027.
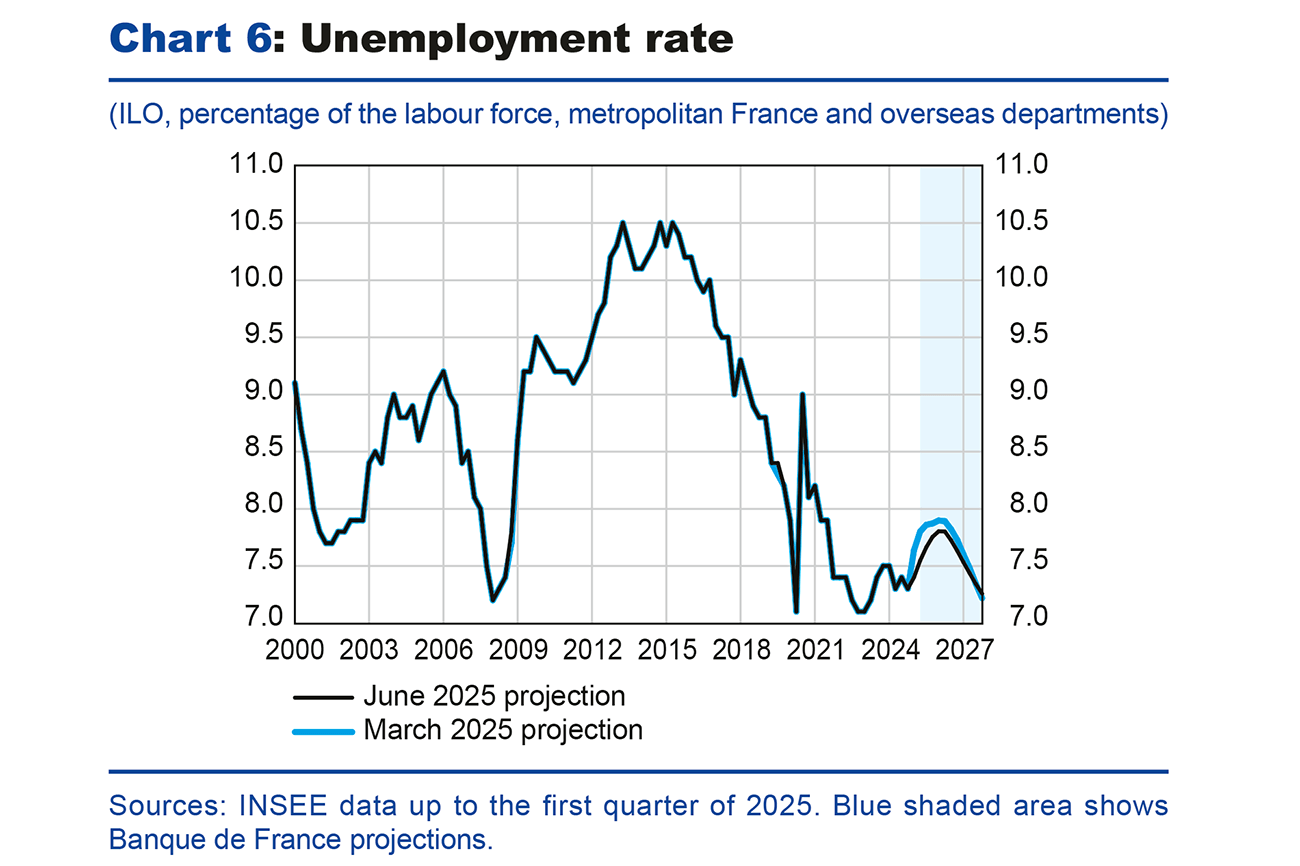
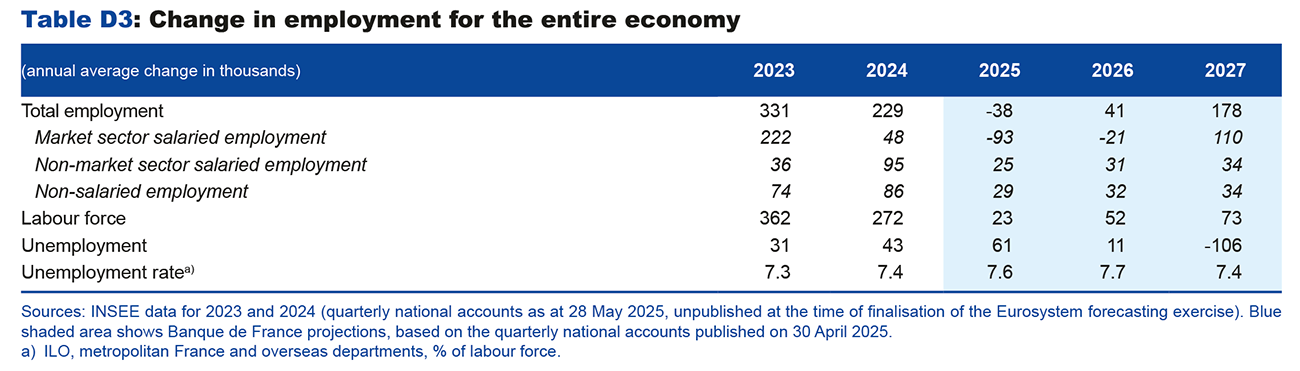
The unemployment rate, which was lower than forecast in the first quarter of 2025, is expected to rise slightly to 7.7% in 2026 before falling back to 7.4% in 2027
As regards the labour market, economic indicators and the national accounts send out mixed signals. On the one hand, the latest INSEE estimates indicate a more moderate decline in salaried employment at the end of March (– 20,900 jobs), following a sharp decline of 98,600 in the previous quarter. According to INSEE’s economic survey for May, the employment climate is expected to improve slightly compared to its low point in February 2025, but should remain below its long-term average. On the other hand, according to the quarterly accounts published on 28 May, total employment fell by 0.1% in the fourth quarter of 2024, and by 0.3% in the first quarter of 2025, mainly due to salaried employment in the market sector, which contracted by 0.2% and 0.3% in the fourth quarter of 2024 and the first quarter of 2025, respectively.
According to our projections, total employment should continue to decline until early 2026, before recovering, albeit at a slower pace than during the post-Covid period. This trajectory is virtually unchanged from our previous projections, due to several offsetting factors. On the one hand, economic indicators are slightly less impaired than we forecast in March. On the other hand, our revised productivity scenario should offset the negative impact of the downward revision of the growth forecast on employment. Indeed, based on our revised assessment of productivity losses observed at the end of 2024 compared with the pre-Covid trend, long-term factors play a greater role in these losses (see Box 3). This implies a smaller catch-up in productivity and therefore less job destruction in the market sector. This means that the productivity cycle should have almost completely closed by the end of 2027.
According to the INSEE employment survey published on 16 May, the unemployment rate is expected to remain virtually stable at 7.4% in the first quarter of 2025, lower than we forecast in our March projections, while the number of unemployed people is expected to increase by 64,000 compared with the fourth quarter of 2024. As a result of this upward surprise, combined with a virtually unchanged employment trajectory, the unemployment rate should be revised downwards compared with our March projections, by 0.2 percentage point in 2025 and by 0.1 percentage point in 2026, but remain unchanged in 2027 (see Chart 6). The unemployment rate is therefore expected to average 7.6% in 2025 and 7.7% in 2026, before falling to 7.4% in 2027.
Household consumption is likely to remain the main driver of growth over the projection horizon
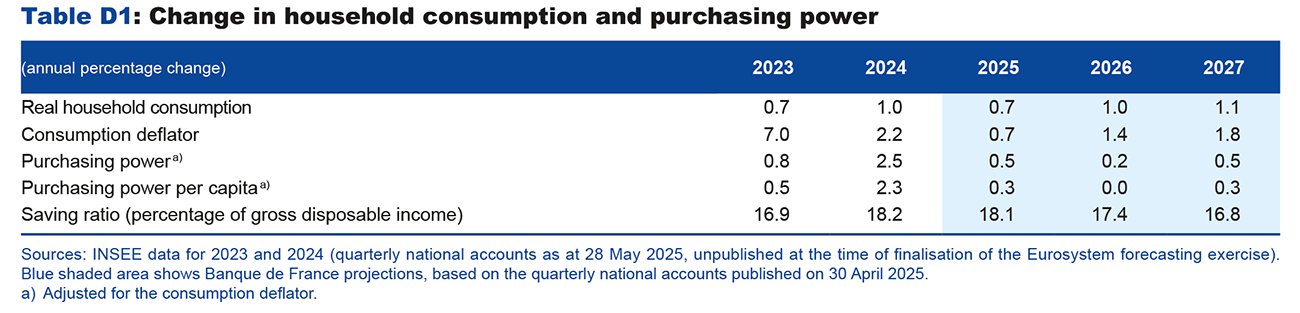
In 2024, real household gross disposable income (GDI) rose sharply by 2.5%, driven largely by social benefits, particularly pensions indexed to inflation with an indexation lag, as well as by strong momentum in financial income. According to our analysis of consumption based on income structure (see J-F. Ouvrard and C. Thubin, Banque de France Bulletin, No. 227/9, and A. Carroy and C. Thubin, Eco Notepad, Post No. 397), the average propensity to spend this income is quite low, which could partly explain the relative sluggishness of consumption in 2024. Thus, with growth of 0.9% in 2024, household consumption would have been more in line with growth in the real wage bill (1.0%), for which the average propensity to spend is significantly higher, making it the main determinant of consumption.
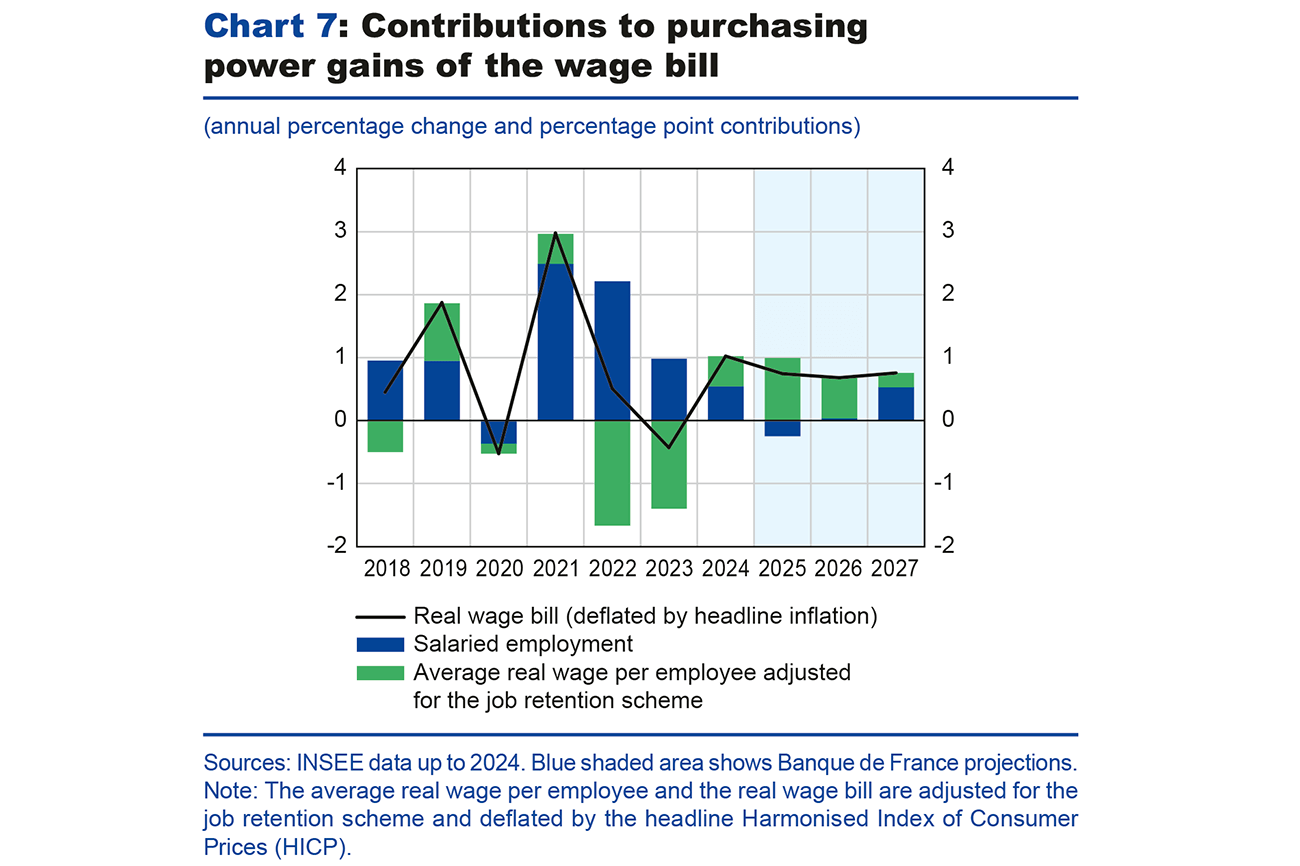
Real household GDI is expected to slow down, growing by only 0.5% in 2025 and by 0.2% in 2026, before picking up again in 2027 (see Table D1). This slowdown in GDI would largely reflect a slowdown in social benefits and property income. However, the real wage bill is expected to grow faster than real GDI and help to sustain consumption. Indeed, the purchasing power of wages should grow steadily over the projection horizon, even if its composition were to change (see Chart 7 below). In 2024, it is estimated to have risen by 1.0%, on the back of increases in both salaried employment and real wages per employee. In 2025 and 2026, it should grow at a slightly slower rate of 0.7%. In 2025, the acceleration in real wages should offset most of the fall in employment. In 2026 and 2027, the stabilisation and subsequent recovery of salaried employment should take over from real wages, which should grow at a more moderate pace. Compared with our March projections, the real wage bill should be revised upwards in 2025, then downwards in 2026 and 2027 due to less dynamic real wage growth.
In the national accounts published on 28 May, household consumption in the first quarter of 2025 fell by 0.2%, revised downwards compared with the quarterly accounts of 30 April on which our projection is based. In the short term, growth in household consumption is likely to remain fairly limited: growth of 0.9% in 2024 is likely to slow to 0.7% in 2025. It should then regain some momentum in the medium term, with growth of 1.0% in 2026 and 1.1% in 2027, thanks to the higher purchasing power of wages described previously. Compared with our March projections, household consumption is expected to be revised downwards in 2025, largely as a result of a carry-over effect from the first quarter of 2025, and in 2026-27, in line with revisions to the real wage bill (see above).
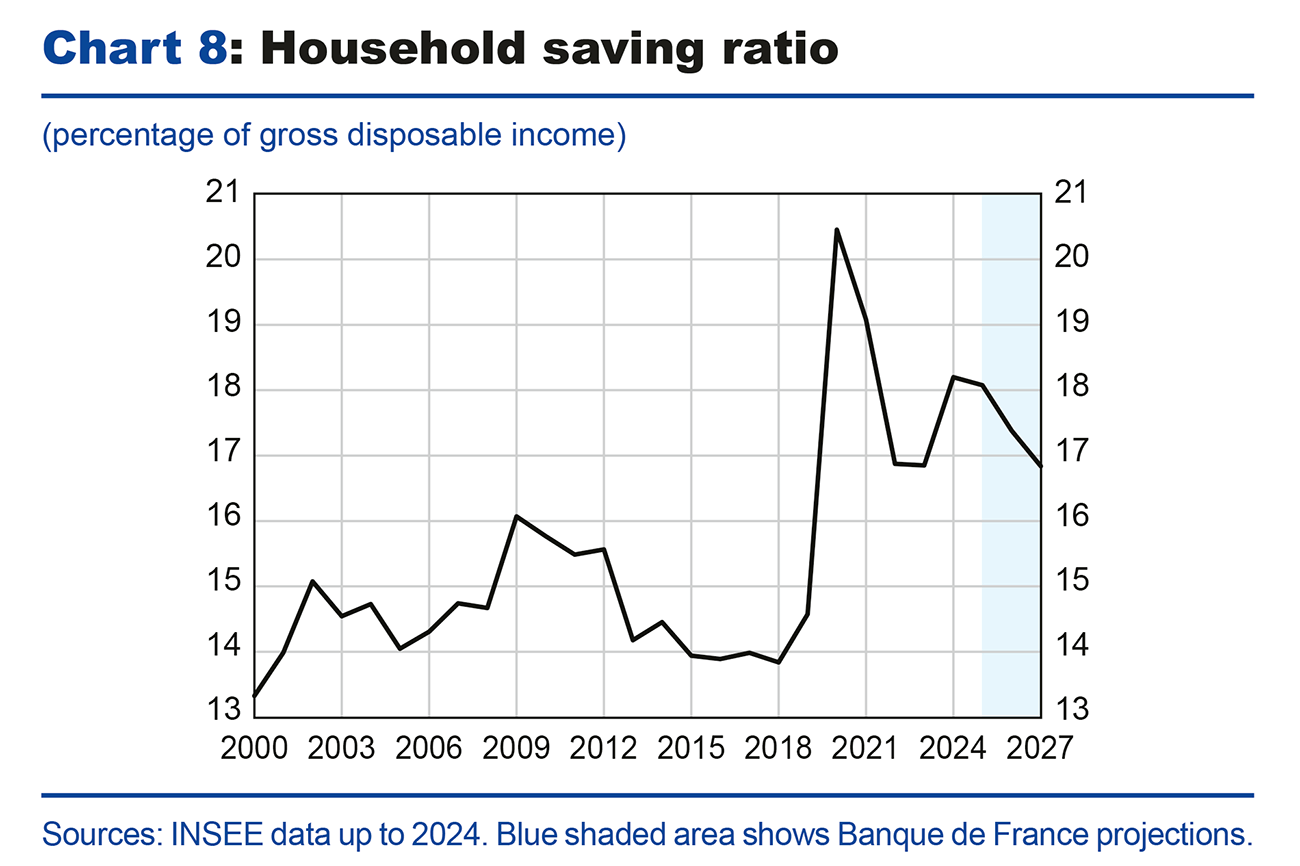
After peaking in 2020 (20.5% of household GDI), the household saving ratio rose again in 2024 to 18.2% according to national accounts published on 28 May. The rise in the saving ratio observed in 2024 is largely driven by the strong momentum in household GDI, while consumption grew at a relatively steady pace (see Box 2). Conversely, with GDI likely to slow from 2025 onwards, while real wages and consumption remain resilient, the saving ratio is expected to start declining, although it should remain above its pre-Covid historical average in 2027 (see Chart 8 below). The slowdown in net interest income is not expected to impact consumption, which should continue to be sustained by growth in earned income. The saving ratio is likely to remain well above its pre-Covid level over the projection horizon, reflecting persistent changes in the income structure and the impact of uncertainty, which is reinforcing the wait-and-see tendency among households (see Box 1).
Household investment contracted sharply by 8.2% in 2023 and by 5.7% in 2024. Nevertheless, several indicators point to a recovery. First, households’ real estate purchasing power has recovered slightly thanks to the easing of interest rates for households and property prices. Second, loans to households picked up over the course of 2024, signalling a resumption of transactions in existing properties and a recovery in household investment in property-related services, although the recovery is still being hampered by a wait-and-see attitude in the market. Lastly, the number of building permits being issued appears to have stabilised after a long period of decline. Provided this momentum continues and feeds through to housing starts, the recovery in new housing should begin around mid-2025. Due to a negative carry-over effect for 2025 at the end of the first quarter of 2025 (-0.7%), household investment is expected to contract further on average in 2025, before recovering by 2.1% in 2026 and 2.0% in 2027, once easier monetary and financial conditions have taken effect and households’ real estate purchasing power has recovered.
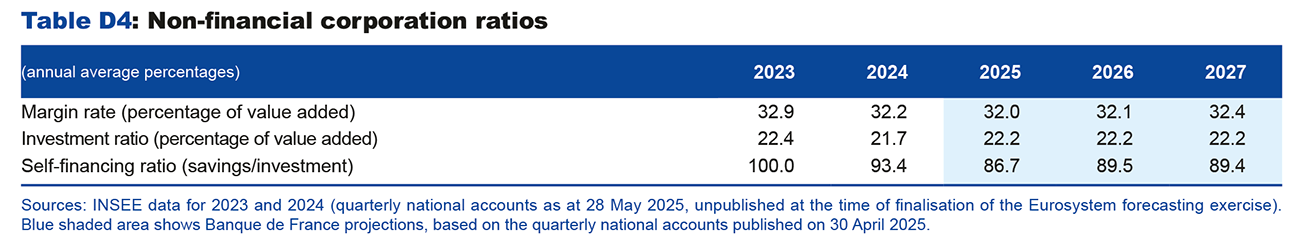
Despite still favourable margin rates, business investment is expected to remain sluggish in 2025, before picking up from 2026 onwards
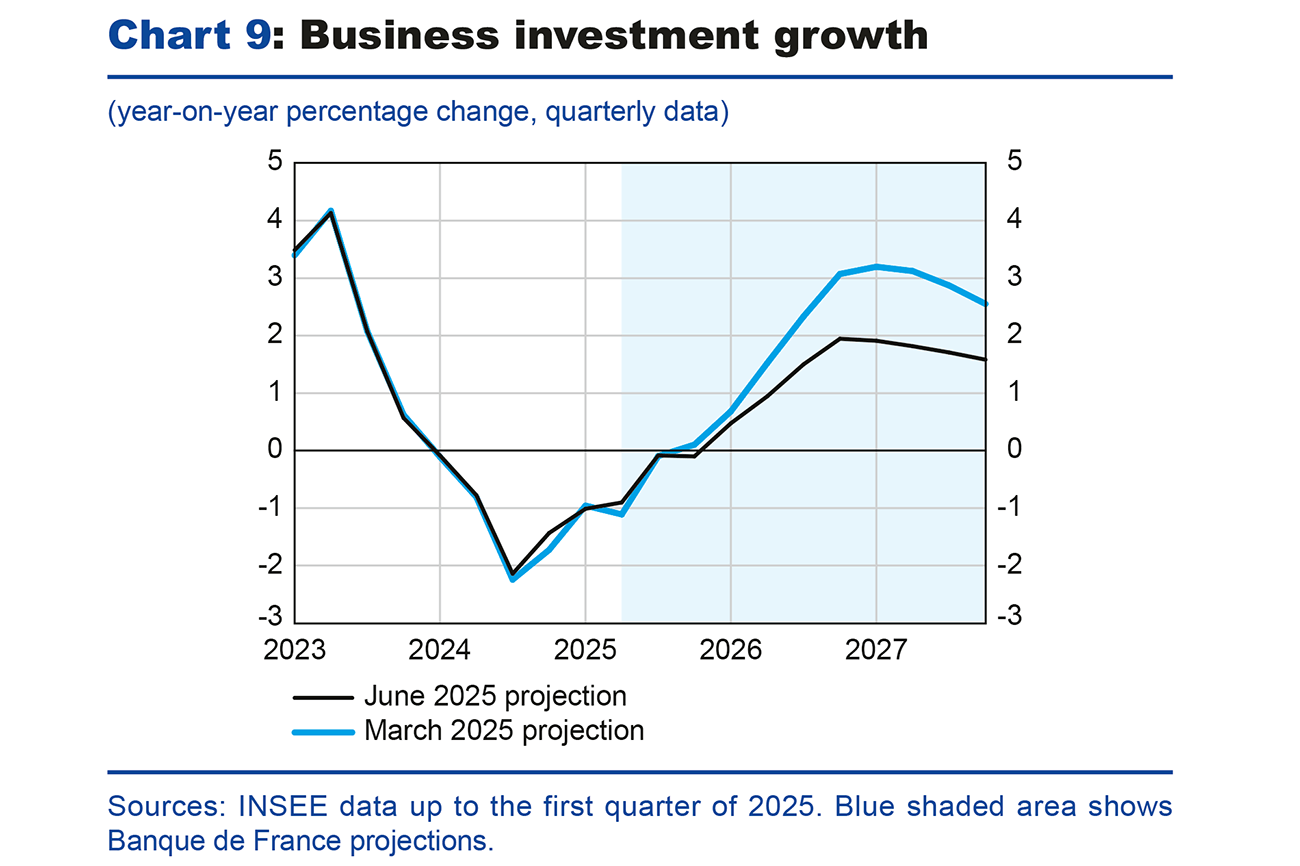
In 2024, business investment was held back by financing costs and bank lending conditions (see Chart 9 below). However, interest rates charged to businesses have started to fall, and the latest bank lending survey shows that the supply of credit is improving and demand is picking up. Nevertheless, against a backdrop of strong uncertainty, particularly related to trade tensions, business investment is expected to remain sluggish until the end of 2025. It should regain momentum over the next two years, boosted by investment requirements in the digital and energy transitions and by additional spending in the defense industry. This recovery is likely to be slightly less dynamic than forecast in our March projections, mainly due to increased uncertainty, weaker final demand and higher investment financing costs over our projection horizon.
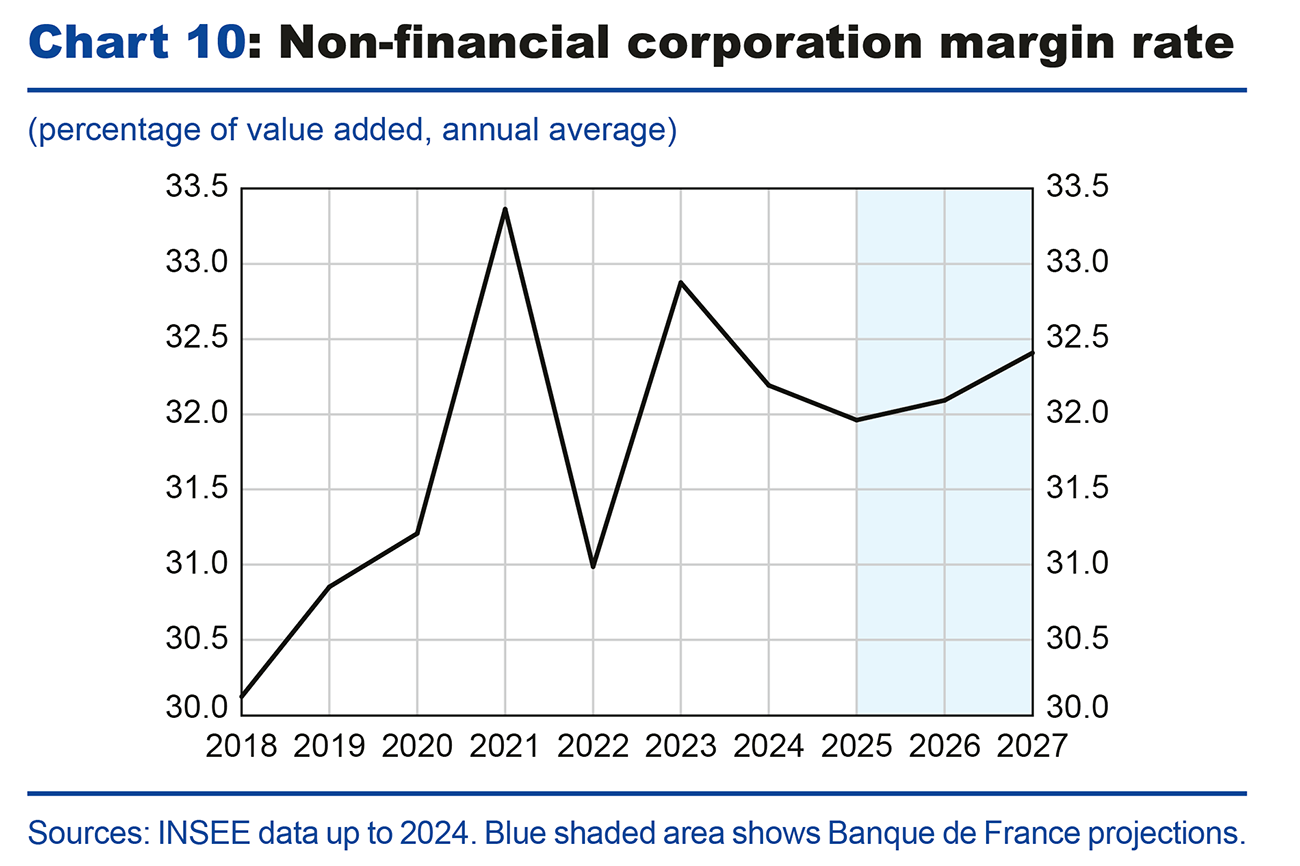
According to the national accounts published on 28 May, the non-financial corporation (NFC) margin rate stood at 31.8% in the first quarter of 2025, in spite of its recent decline. This is 1 point above its average level of 2019. The margin rate is expected to remain a factor supporting investment, remaining at a relatively high level in 2026 and 2027 (see Chart 10), above that of the pre-Covid period, mainly due to past production tax cuts. While the NFC margin rate only partially reflects the financial situation of businesses, its high level nevertheless suggests that there is scope for investment to pick up once the uncertainty shocks have passed.
Exports are expected to slow sharply in 2025 due to an increase in US tariffs and weak demand for euro area exports
In recent years, exports have been vibrant and have contributed significantly to French growth, rising by 2.8% in 2023 and 2.4% in 2024. In 2024, foreign trade was even the main driver of the French economy, contributing 1.3 points to GDP growth. According to preliminary estimates from the national accounts published on 28 May, in the first quarter of 2025, exports are estimated to have declined by 1.8%, reflecting the drop in exports of manufactured goods (particularly in the chemical and automotive industries).
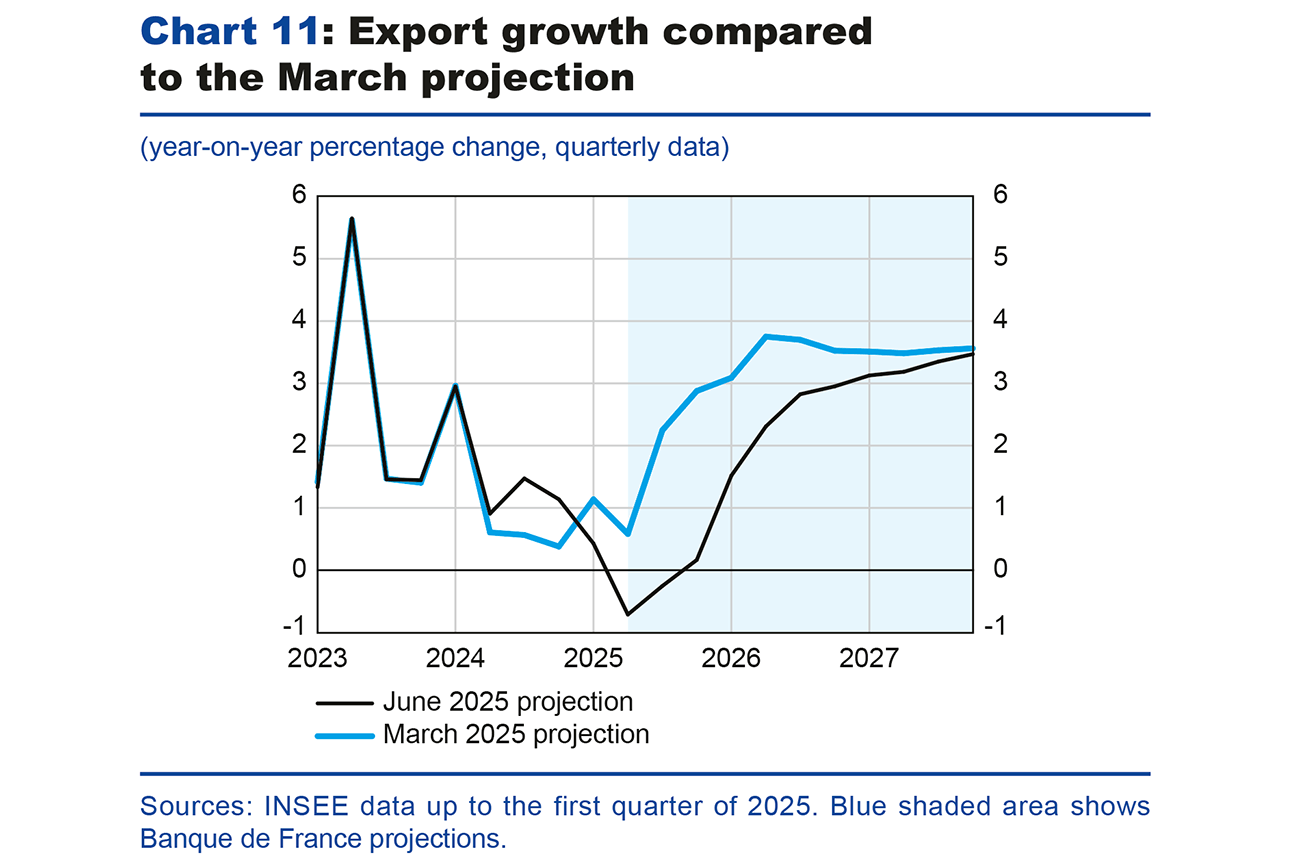
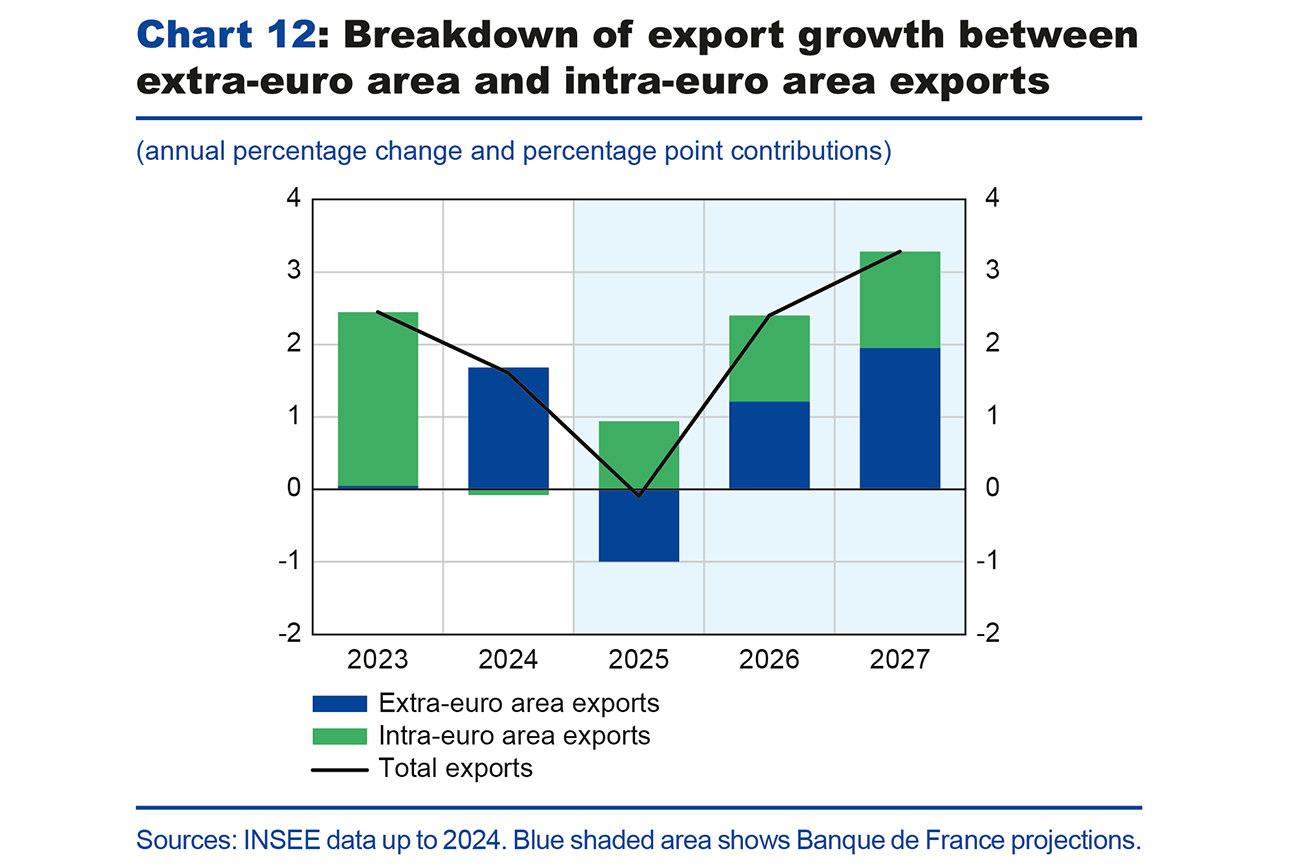
Over the projection horizon, export growth is expected to be revised downwards overall compared to our previous projections, only returning to the growth rate forecast in March at the very end of 2027 (see Chart 11). In 2025, exports should decline by 0.1%. In particular, extra-euro area exports are expected to decrease sharply due to higher tariffs, which weigh on demand from non-euro area countries (mainly on account of lower US imports, see Box 1), but also due to the appreciation of the exchange rate. The contribution of extra-euro area exports to total exports is estimated at around -1 percentage point. Conversely, after being relatively stagnant in 2024, intra-euro area exports are expected to sustain total export growth to the tune of 0.9 percentage point (see Chart 12). From 2026 onwards, extra-euro area exports should pick up and become the main driver of total export growth, ahead of intra-euro area exports. Furthermore, we assume that the effects of the shift of Chinese trade towards the French economy would be limited.
The government deficit should decline from 2025 onwards, but not enough to stabilise the public debt ratio over the projection horizon
The government deficit deteriorated further in 2024, to stand at -5.8% of GDP, after -5.4% in 2023. This can be explained by two factors. On the one hand, the ratio of public expenditure to GDP increased by 0.3 percentage point, due to the rise in inflation-indexed benefits in 2023 and the rebound in interest payments. On the other hand, the ratio of government revenue to GDP fell by 0.1 percentage point: revenue from taxes and social security contributions is rising but by less than GDP in value terms.
In 2025, the government deficit is expected to decline to -5.4% of GDP, as forecast in the initial Budget Act for 2025. The tax measures provided for in the Act are expected to push up taxes and social security contributions as a percentage of GDP. Public expenditure excluding interest payments should grow less rapidly in 2025, thanks to the savings voted in the initial Budget Act, which should stabilise the ratio of primary expenditure (excluding tax credits) to GDP. Conversely, interest payments as a percentage of GDP are expected to rise again. Overall, the public expenditure ratio excluding tax credits is expected to edge up in 2025 and should therefore still be higher than the 2019 ratio.
In 2026 and 2027, the conventional assumptions adopted regarding budget savings suggest a primary structural adjustment of 0.6 percentage point of potential GDP in 2026, and 0.4 point in 2027. This adjustment is lower than that forecast by the French government in the Annual Progress Report published in April (0.9 point in 2026 and 0.7 point in 2027), based on savings not yet specified pending the 2026 draft Budget Act. Under these assumptions, the government deficit should fall slightly below the threshold of 5% of GDP in 2026 and continue to improve in 2027.
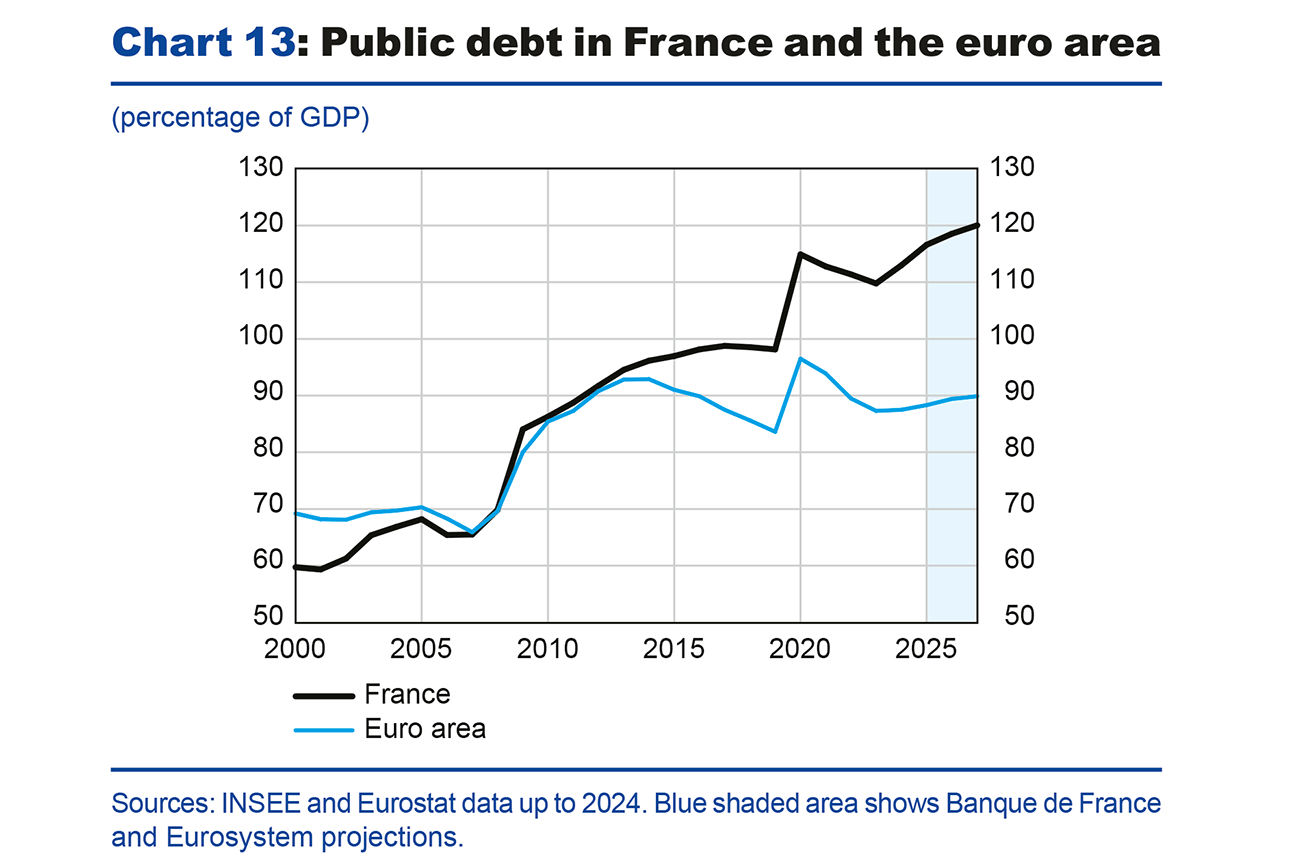
However, the fiscal adjustment in our scenario would be insufficient to stabilise the debt-to-GDP ratio by 2027. This is expected to increase over the entire projection horizon, reaching 120% of GDP in 2027 (see Chart 13). This would widen the gap with the euro area as a whole, where the debt-to-GDP ratio is expected to be close to 90% in 2027.
Risks to growth are on the downside, as are those to inflation, albeit more moderately
In view of the successive announcements of tariff increases, followed by their suspension for a period of 90 days, it is obviously difficult to develop a most likely central scenario.
A large number of uncertainties surround the trade policy scenario adopted. The first concerns the trajectory of tariffs and their impact on international assumptions, in particular on global demand and the prices of France’s competitors. If US tariffs on European goods were raised from 10% to 20%, or even higher, then demand for French exports from outside the euro area would be much weaker. A second uncertainty concerns the European response. If the European Union was to retaliate, this could result in an upside risk to inflation, via higher prices for imported goods, and a downside risk to GDP. Conversely, a significant shift in Chinese exports towards the European market would exert downward pressure on inflation; a further depreciation of the US dollar against the euro could also reinforce this downside risk to inflation. Finally, a last factor of uncertainty concerns our assumptions relating to the pattern of uncertainty in trade tensions, which we assume will gradually diminish. If this uncertainty proved more persistent, this would pose an additional downside risk to private investment and household consumption in 2026 or even 2027. In Box 1, we present an alternative scenario illustrating part of these uncertainties.
These trade risks are compounded by geopolitical risks and risks relating to French economic policy. The war in Ukraine and the situation in the Middle East remain sources of instability, which could put upward pressure on oil and gas prices, as well as shipping costs, resulting in upside risks to inflation and downside risks to economic activity. In addition, there remains considerable uncertainty surrounding the future 2026 Budget Act.
Boxes
The increase in tariffs and the related economic uncertainty are expected to represent
a cumulative loss of 0.4 percentage point of GDP for the French economy by 2027,
half of which was already included in our March forecast
The increase in US tariffs represents a shock to the European economy, with a negative effect on GDP and a neutral effect in principle on inflation. In our interim projections in March (i.e. prior to the US announcements of 2 and 9 April), the international scenario only factored in measures that had been officially announced by the US administration, namely a 10 percentage point increase in US tariffs on imports from China, as well as measures taken by China in response. However, our projection included a cumulative negative impact of -0.2 percentage point of GDP (-0.1 percentage point of GDP in 2025 and in 2026) due to the uncertainty caused by the threat of tariff measures against the United States’ other trading partners, including the European Union.
In the June projection, the international trade scenario is based on the shared Eurosystem assumptions (see the Eurosystem staff macroeconomic projections for the euro area, June 2025) that tariffs will remain at their current level. More specifically:
- It factors in US tariffs of 10% on EU exports from the second quarter of 2025, without any retaliatory measures on the part of the EU, as well as sector-specific measures, in particular in the steel and automotive industries (25% tariffs);
- As regards US-China trade relations, the projection assumes a 30% increase in US tariffs, with China applying equivalent retaliatory tariffs on US exports. With its other trading partners, it is assumed that the United States would maintain tariffs of 10% from the second quarter of 2025. The effects of a shift in Chinese trade towards the European economy would be limited, as would the market share gains for French businesses over their Chinese competitors on the US market;
- It is assumed that the uncertainty surrounding trade policy (as measured by the Trade Policy Uncertainty Index) should gradually fall to the level noted in 2018 when tariffs were raised (a level already above its historical average).
According to our estimates, the direct and indirect effects of the US administration’s trade policy on French GDP growth should amount to a cumulative -0.4 percentage point over the 2025-27 period, relative to a counterfactual scenario with no increase in tariffs or uncertainty. This impact is primarily driven by the effect of uncertainty as the mechanical impact of tariffs is moderate. Compared with the March interim projections, the impact has therefore been revised downwards by -0.2 percentage point (in light of the -0.2 percentage point already included in March). By way of comparison, the ECB estimates that the cumulative impact on the euro area economy will be -0.7 percentage point over the 2025-27 period. The lower impact in France is primarily due to its lower exposure to trade with the United States than the rest of the euro area.
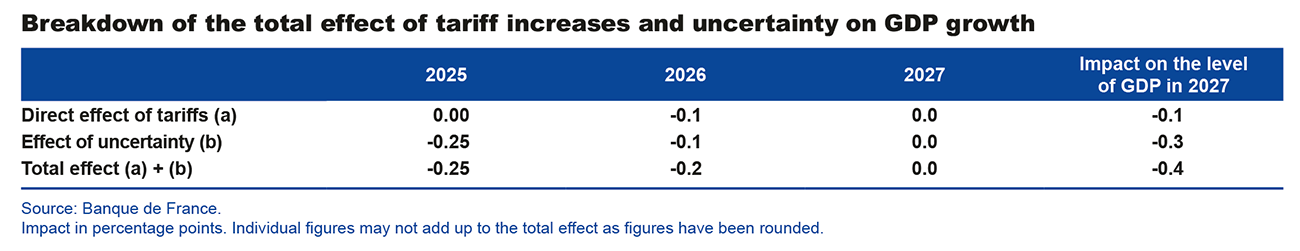
The cumulative impact on GDP of the uncertainty surrounding trade policy would be the highest, at -0.3 percentage point, in 2025-27. Thus, in addition to a cumulative impact of -0.2 percentage point of GDP already factored into our March projection (-0.1 percentage point of GDP in 2025 and 2026), we estimate that the increased uncertainty in the wake of the US announcements in April would cost the French economy an additional 0.15 percentage point of GDP, mainly in 2025. This impact would be felt in both business investment and household consumption.
As part of this projection exercise, we simulated a severe alternative scenario that corresponds to one of the two scenarios presented by the ECB for the euro area as a whole (we did not, however, consider the favourable scenario, with zero tariffs). Under this scenario, tariffs on EU goods would rise to 20%, with retaliatory measures of the same magnitude being imposed on US exports, and uncertainty over trade policy remaining high for a long time. GDP growth would then be reduced by 0.3 percentage point in both 2025 and 2026 and unchanged in 2027 compared with our projection. However, the French economy would avoid recession, with growth of 0.3% in 2025 and 0.7% in 2026. In this scenario, the impact on inflation would be broadly neutral.
The higher than expected saving ratio over the past two years is mainly due to revisions to household income
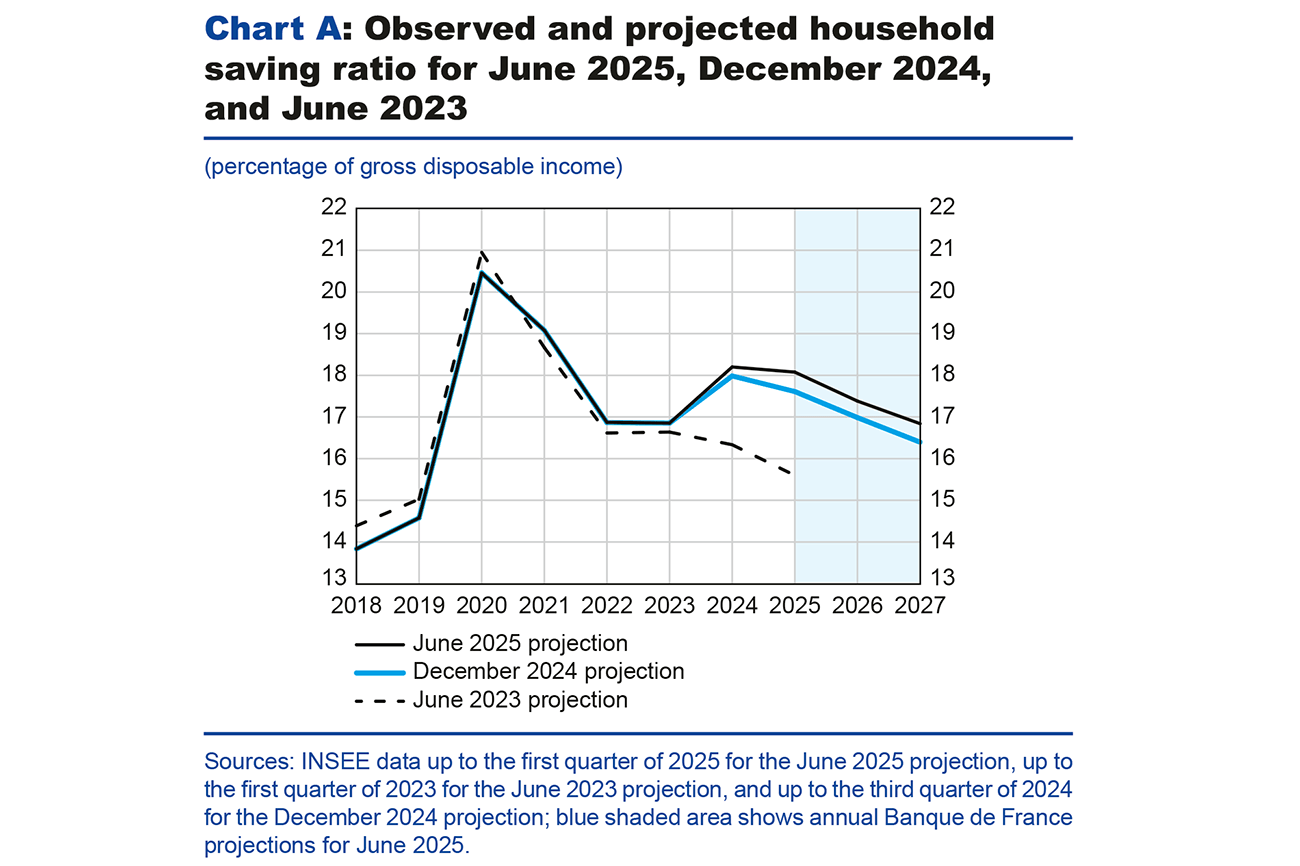
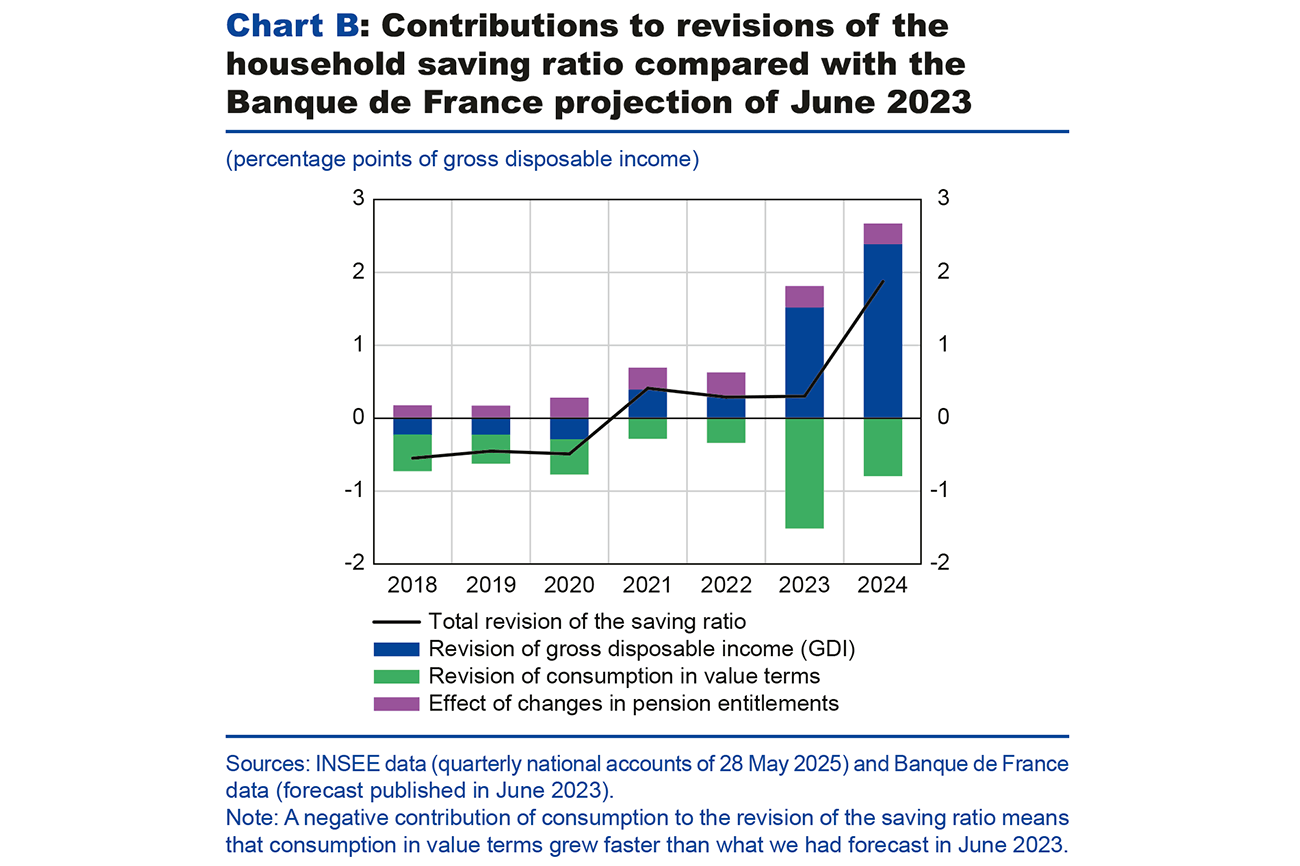
Contrary to our June 2023 forecast, the household saving ratio, which corresponds to the share of gross disposable income (GDI) not spent, has not returned to its pre-Covid level over the past two years (see Chart A). In fact, it actually rose sharply in 2024, despite higher-than-expected growth in household consumption. The main reason for this was the sharp upward revision of the increase in household disposable income in 2023-24.
Revisions to the saving ratio since our June 2023 projections can be broken down in accounting terms according to revisions to nominal household GDI and to consumption in value terms (see Chart B). Following the 2020 benchmark revision for the national accounts, the inclusion of pension entitlements in the calculation also pushes up the saving ratio. This methodological change aims to more accurately reflect the fact that pension entitlements are a form of deferred savings (See INSEE 2020 benchmark revision of the national accounts).
Whereas in our June 2023 projection, we forecast cumulative growth in household GDI of 10% over 2023 and 2024, this ultimately came out at 12.7% in value terms according to the national accounts published on 28 May, representing an upward revision of 2.7 percentage points. For consumption, by comparison, we had forecast cumulative growth (in value terms) of 10.4% between 2023 and 2024: this ultimately reached 11%, an upward revision of 0.6 percentage point. This assessment confirms that fluctuations in the saving ratio primarily reflect those in household income, as household consumption is generally “smoother” than gross disposable income (what economists refer to as “consumption smoothing”).
Compared with our December 2024 projections, GDI and the saving ratio have been revised upwards again for 2024, albeit by less. The forecast is slightly higher notably due to the effects of trade policy uncertainty on household consumption. In contrast, the cumulative increase in purchasing power over the 2025-27 period is broadly unchanged in our June projections when compared with December, although the composition of income is expected to be slightly less favourable to consumption, due to slightly slower real wage bill growth. Nevertheless, wage growth is expected to remain the main driver of household consumption.
Long-term market sector productivity losses have been revised upwards
Based on the quarterly national accounts published in May 2024, our estimate of total labour productivity loss compared to its previous trend (2010-19) stood at 5.9% in the second quarter of 2023.1 This loss was explained by both long-term factors (mainly apprenticeships and the composition effect of the workforce) and temporary factors (mainly labour hoarding), which contributed 3.1 percentage points and 1.8 points respectively. This left an unexplained share of 1.0 percentage point, of which 0.6 point was considered long-term (in proportion to the weight of long-term factors in the explained loss). The total long-term loss was therefore 3.7% (see the first column of the table below).
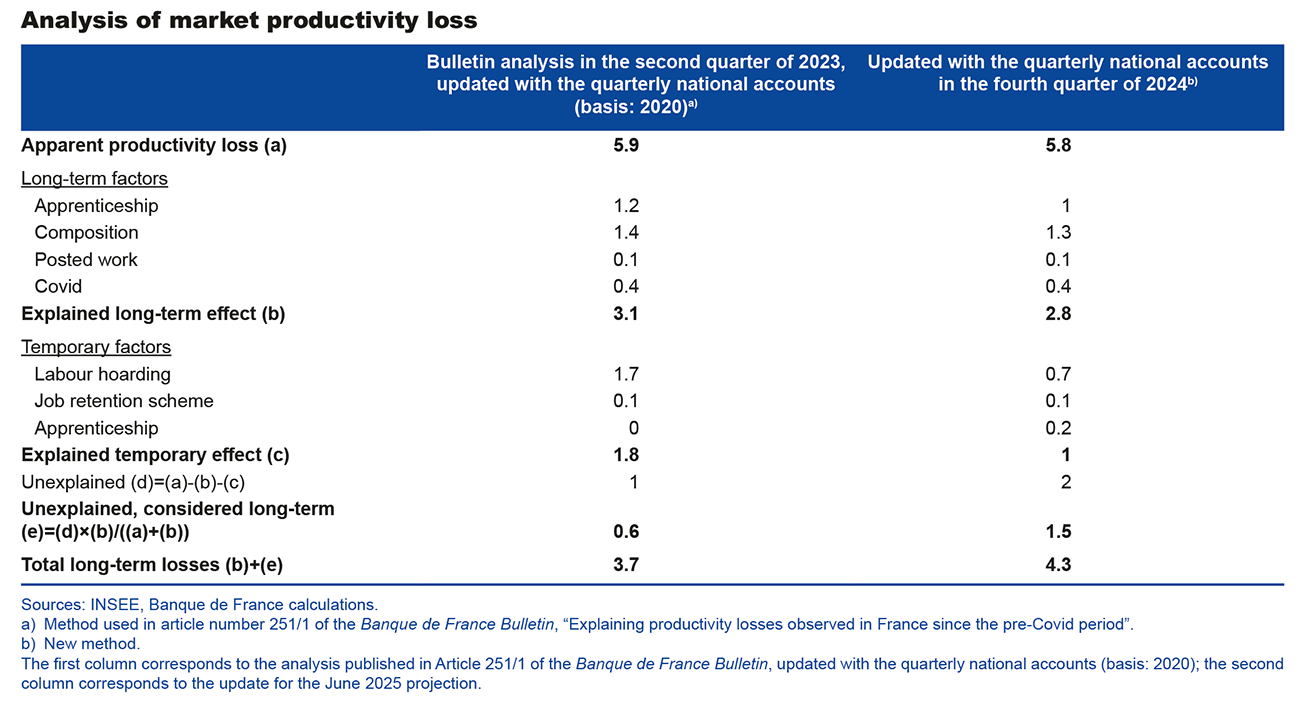
An update of the figures for certain factors for the fourth quarter of 2024 (see the second column of the table) yields a total productivity loss for this quarter that is almost identical to that estimated for the second quarter of 2023 (5.8%). The most notable change is the revision of our estimate of the temporary effect of labour hoarding, whose contribution to the loss has declined from 1.7 to 0.7 percentage points.
This revision results, on the one hand, from the incorporation of the national accounts published on 30 April, and, on the other, from an improvement in the method used. The latter, which is applied to the accounts of the market sectors, is based on a dual analysis: first of productivity, second of margins (as labour hoarding is likely to weigh on the margins of the sectors concerned).2 We believe that the new method is more robust and more cautious than the method previously used.
Also worth noting is the slight revision of the contribution to productivity loss of the labour composition effect (-0.1 percentage point) and the fact that part of the effect of the increase in apprenticeships (0.2 percentage point) is now considered temporary (corresponding to the expected effect of lower incentives to hire apprentices from 2025 onwards). The unexplained share is therefore 2.0 percentage points, of which 1.5 points are deemed long-term and 0.5 point temporary. The latter could include the effects, which are difficult to quantify at the aggregate level, of the decline in business failures among the least productive firms during the Covid crisis.
Ultimately, this update leads us to revise upward, to 4.3%, the total long-term market sector productivity loss (compared to its pre-Covid trend). However, since there is less catching up, this results in lower productivity gains in our projection for 2027. Of course, our trend productivity projections are surrounded by uncertainty: on the upside, with possible gains linked to the adoption of artificial intelligence, but also on the downside, with the effects of the energy transition.
This update to our assessment has three implications for our projection: a downward revision of potential GDP due to lower labour efficiency; employment less affected by the downward revision of activity, as its effect is offset by lower productivity gains; and a downward revision of real wage growth, which is less driven by productivity gains.
1 Our initial assessment of market sector productivity loss since the pre-Covid period was based on data prior to this publication. Productivity loss in the second quarter of 2023 was then estimated at 8.5% compared to the 2010-19 productivity trend (see Devulder et al., 2024, Banque de France Bulletin No. 251/1).a
2 In our approach, the effect of labour hoarding only concerns sectors in which margin and productivity losses have been observed compared to their pre-Covid trends (2010-19). In sectors where margins and productivity have remained stable or increased compared to these trends, the effect is assumed to be zero.
Appendixes
Download the full publication
Updated on the 27th of June 2025