The fact that central banks’ communication frequently refers to measures containing information on future inflation highlights their importance in the monetary policy decision-making process. These measures raise many questions as to their informative content:
- Is the weight of expected future inflation in the dynamics of current inflation increasing (Blanchard et al., 2016)?
- Does taking into account the distribution of survey data improve the perception of macroeconomic risk (Odendahl, 2019)?
- How strong is the anchoring of inflation expectations (Mouabbi, 2018)?
- What is the level of respondents' disagreement on both projections and revisions in the surveys (Andrade et Le Bihan, 2013) ?
- Finally, do inflation projections help to improve inflation forecasts?
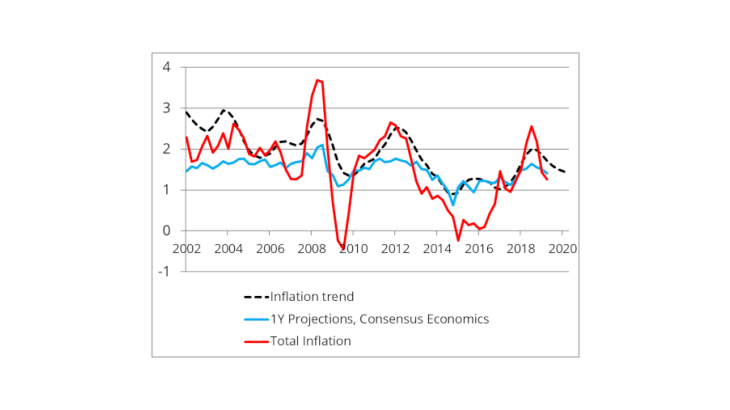
Chart 1 represents the projection of the underlying inflation trend (in black dashed lines) when both total inflation (in red) and inflation projections (in blue) are taken into account, the latter being defined as the one-time average of the answers from Consensus Economics Inc. surveys. In the case of a simple model with total inflation and unemployment, taking inflation projections into account improves inflation forecasts for France by better capturing the persistence of inflation. The inertia of the projections may in particular help to explain why inflation has remained permanently low over the recent period.
Perceiving future inflation: mobilising survey data rather than market data?
There are essentially two sources of information on future inflation: financial market data and survey data. They each have advantages and disadvantages.
Market data containing information on inflation are relatively abundant, the main ones being inflation-linked bonds and swaps. These measures have the advantage of being available since the 2000s at a high frequency and to react rapidly to information concerning the economy. However, they incorporate risk and liquidity premiums, which are difficult to quantify and may introduce "noise" in the measures of future inflation.
Survey data also provide a wealth of information on future inflation. Respondents are asked about their estimation of future inflation or about the probability of inflation being within a particular range. These surveys can be conducted with institutions, businesses, households or professional forecasters as is the case with the Consensus Economics Inc.. Several recent studies attest to the informative content of these survey data, both in terms of median values and distribution of responses.
Taking account of Consensus Economics Inc. projections improves inflation forecasts in France
Consensus Economics Inc. surveys provide, monthly, the average of one-year inflation projections made by economists and experts for France for the period 1999-2019.
The exercise is based on the statistical estimation of a simple quarterly model linking total inflation to unemployment. The model, which introduces a trend for total inflation and unemployment, is similar to the models described by Hasenzagl et al. (2018) and Basselier et al. (2018). Total inflation is explained by its trend (a first-order integrated process), contemporary oil prices and a variable that measures the position in the cycle – to model the transmission of tensions on activity to prices (Phillips curve effect). A variant of this exercise also adds an equation describing inflation excluding food and energy to the system.
We consider that the average of one-year inflation projections, as measured by Consensus Economics Inc., represents economic agents’ rational expectations within normal measurement error. The exercise then consists in comparing the gap between actual and forecast inflation obtained for the following four quarters when one-year inflation expectations are given by the average of Consensus Economics Inc. projections for France.
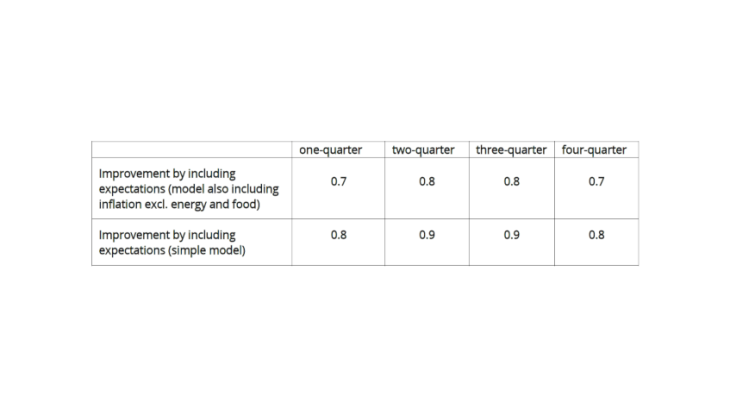
The results of the one-year forecasting exercises, with and without taking account of projections, estimated since 1999 for the period 2009-2018, are shown in Table 1. They indicate that adding the one-year Consensus Economics Inc. projections improves the ratio of the absolute value of the error by around 20%; indeed, the one-quarter absolute error when inflation projections are taken into account is 0.8 times smaller in the simple model. Adding inflation projections thus leads to a more persistent inflation trend without introducing any greater uncertainty in the estimation of the parameters.

