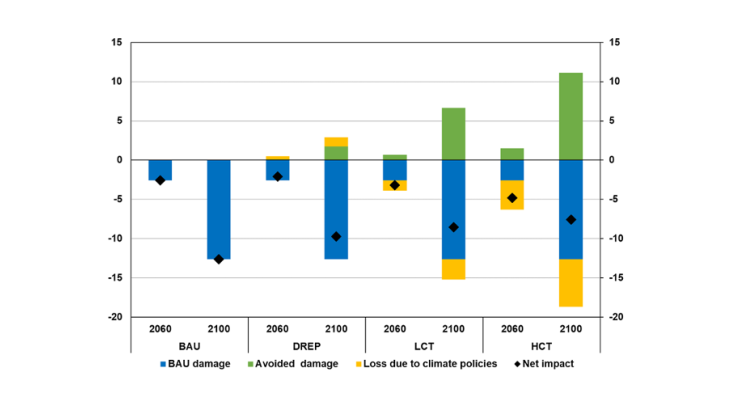
Notes: Scenarios: BAU=no climate policy, DREP=2% annual decrease in the price of non-CO2 emitting energies, LCT and HCT=annual increase in the price of CO2 emitting energies of 1% and 3% respectively (Alestra, Cette, Chouard and Lecat (2020).
Climate policy has so far had limited effects. While greenhouse gas (GHG) emissions are expected to fall in 2020 due to the "Great Lockdown", they have continued to increase at an annual rate of 2% per year since the first COP (Conference of the Parties) in 1995. Indeed, climate policy comes up against the divergences between advanced countries and the development needs of emerging countries. In order to convince the world population of its relevance, this policy must be based on scientific studies and diversified analyses of its economic consequences. This post presents a tool for constructing climate policy scenarios which highlights both the gains and the difficulties that accompany such policies. The net benefits thus appear significant but remote in time and unevenly distributed between countries.
How to determine the cost-benefit balance of climate policy ?
Climate policy here is mainly based on raising the price of GHG-emitting energies, either through a carbon tax or emission rights, or through regulations that increase the cost of their use. As a result, adjustments are made in the production process, either to use cleaner energy or to save on energy consumption. This affects companies’ profitability and productivity and, consequently, their long-term growth. Climate policy therefore has an economic cost that materialises quickly.
Its benefits appear in the longer term, in the form of avoided damage. We focus here on damage with a direct impact on GDP, but the damage goes far beyond that, with impacts on health, international conflicts, and biodiversity. The consumption of GHG-emitting energy leads to a rise in global temperature, which results in a loss of land surfaces, agricultural yields, damage to the production facilities caused by natural disasters, etc. Exposure to this damage varies across countries according to their dependence on agriculture and localised climatic phenomena such as the monsoon. In the scenarios presented here, this damage rises faster than the concentration of GHGs in the atmosphere, which corresponds to the relationship drawn from the literature review by Nordhaus and Moffat (2017). Nevertheless, there is no tipping point beyond which global warming picks up speed, for example with the melting of permafrost.
The challenge of a long term horizon and of the unequal distribution of the benefits of climate policy
Four scenarios, applied uniformly to all countries, are considered:
- Business as usual (BAU): no climate policy;
- Decrease of Renewable Energy relative Price (DREP): 2% annual decrease in the price of non-CO2 emitting energies;
- Low carbon tax (LCT): 1% annual increase in the price of CO2 emitting energies;
- High carbon tax (HCT): 3% annual increase in the price of CO2 emitting energies.
In terms of CO2 emission, neutrality can be reached only with the HCT scenario, and only in 2100. The temperature rise is above 5°C in the BAU and DREP scenarios, close to 4°C in the LCT scenario and close to 2°C in the HCT scenario in 2100. Only in the HCT scenario is it possible to come closer to the objectives of the Paris agreement, which aim at containing global warming "well below 2°C compared to pre-industrial levels". The DREP scenario has a limited impact: despite fairly high substitution elasticities between CO2 emitting and non-CO2 emitting energies (between 1 and 2), the small proportion of clean energies today limits the gains of such a scenario. Nevertheless, the latter could emerge naturally thanks to technical progress leading to a rapid drop in their production cost, or through the mobilisation of the carbon tax to subsidise their use.
Measured in terms of world GDP (see Chart 1), these results illustrate the challenge of the long term perspective or "tragedy of the horizon": the strategies with the lowest economic damage in 2060 are the absence of climate policy and the DREP scenario, while in 2100, the most favourable scenario in terms of GDP is the HCT scenario, with significant gains compared to the BAU scenario.
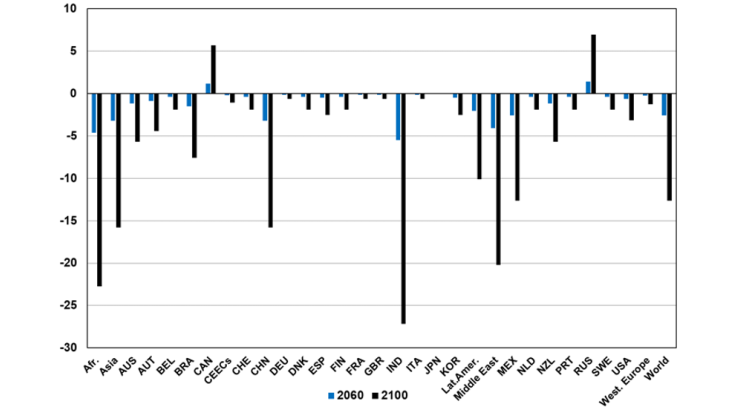
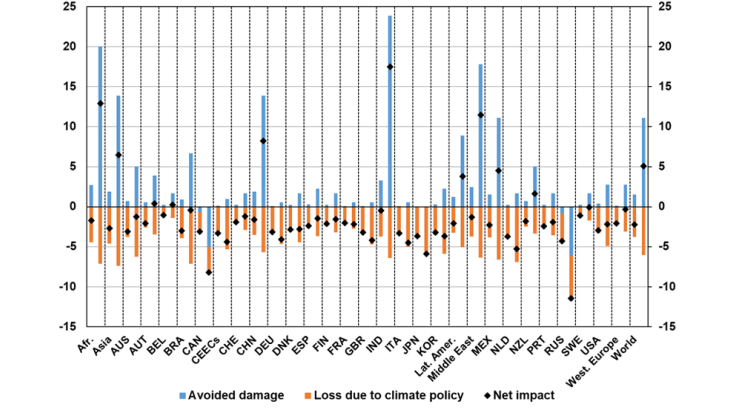
Another outstanding fact of this exercise is the unequal distribution of damages, which gives rise to the "tragedy of the commons". The distribution of the damage caused by global warming (see Chart 2), and thus of the benefits of a climate policy that prevents it, is very uneven. Some countries will suffer losses of over 15% of GDP by 2100 (such as China), or even 20% (such as India, some African and Middle Eastern countries). Other areas will suffer limited damage (such as Europe) or even derive exceptional benefits from global warming through the extension of arable land or an increase in agricultural productivity (such as Canada and Russia).


