- Home
- Publications et statistiques
- Publications
- Are SRI-certified funds greener?
Are SRI-certified funds greener?
Post n°311. Socially Responsible Investment (SRI) funds take account of social, environmental and governance considerations in their investment policy. Are they really greener than non-certified funds? Indeed, portfolio analysis suggests that on average they are. However, certification does not necessarily guarantee environmental excellence.

Green finance aims to promote the energy transition and the fight against global warming, in particular by directing investments towards more sustainable activities that are less harmful to the environment. However, its growth over the last ten years has been accompanied by a suspicion of greenwashing, in other words, of ecological claims that do not reflect reality.
In the case of the investment fund market, certification with the French socially responsible investment (SRI) label enables investors to recognise funds that are committed to "responsible" investment. Such certification is awarded by an independent body on the basis of the inclusion of environmental, social and governance (ESG) criteria in the fund's investment policy (see Candus and Le Goff, 2020; Jourde and Kone, forthcoming article in the Banque de France Bulletin). Thus, certified funds are expected to have a more sustainable investment policy than non-certified funds. And the credibility of this certification is based on their ability to meet this expectation.
Against this backdrop, we focus here on the difference in "carbon intensity" between the investments of SRI certified funds and those of non-certified funds. Using the carbon intensity of a portfolio, we can determine the extent to which one euro of investment in the portfolio finances companies that are more or less green. It is calculated by taking the weighted average of the carbon intensities of the companies receiving investment (expressed in tonnes of carbon dioxide equivalent (tCO2eq) per million euro of revenue).
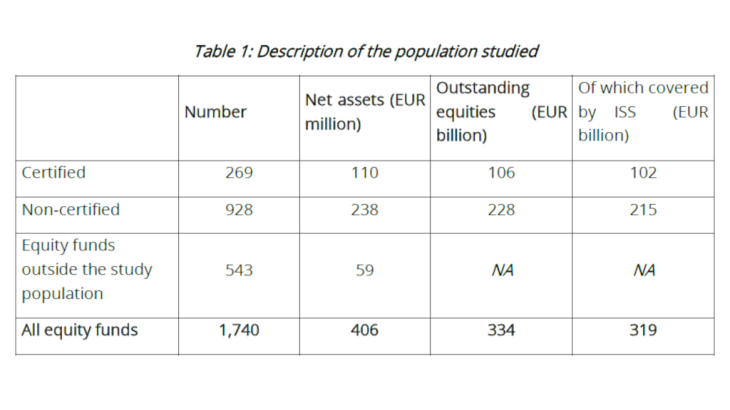
The analysis focuses on the equity portfolio of French equity funds as at 31 December 2021. This sample restriction allows for a relatively simple analysis due to the homogeneity of the financial instruments without sacrificing its comprehensiveness, since equity funds represent a significant financial volume (EUR 406 billion at the end of 2021, see Table 1), i.e. 27% of the net assets of all non-money market funds. Furthermore, this population's portfolio is relatively well covered by greenhouse gas (GHG) emission data. Carbon intensities of companies receiving investment are thus available (possibly with a one-year lag) for 95% of the stocks in the portfolio (ISS database, produced by a data provider marketing ESG data on companies). This database aggregates data from annual or sustainability reports (for 47% of the investments in the population studied), questionnaires conducted by the Carbon Disclosure Project, an international non-profit organisation (44% of our sample), and estimates made by the data provider (8%).

The carbon intensity of certified funds is on average lower than that of non-certified funds
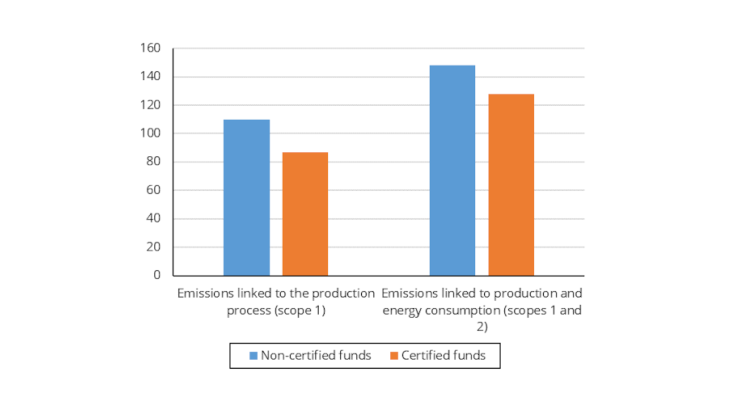
A comparison of the carbon intensity of equity portfolios reveals a significant difference between SRI-certified funds (identified by the Banque de France database) and non-certified funds. SRI funds finance "greener" companies on average: the carbon intensity of their portfolio is 21% lower than that of non-certified funds for emissions linked to the production process (scope 1), and 14% lower for the broader scope of emissions linked to production and energy consumption (scopes 1 and 2) (Chart 1).
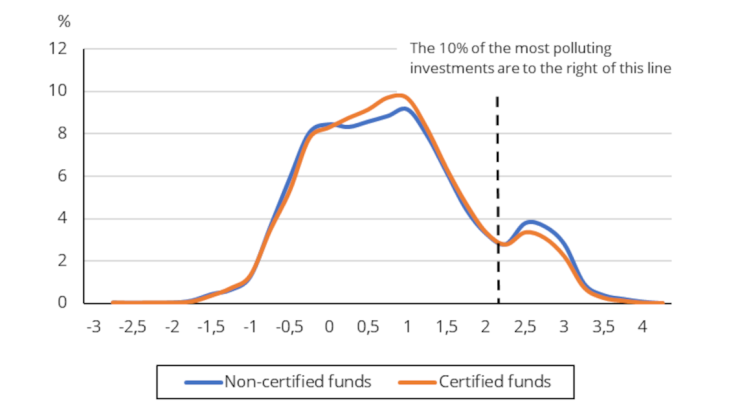
However, the portfolio distribution by level of carbon intensity of investments is very similar between certified and non-certified funds (see Chart 2, where we can see, for example, that investments with a carbon intensity of around 1 (i.e. 10 tCO2eq/M€, based on the decimal logarithmic scale used) represent nearly 10% of the equity portfolio of certified funds, compared with 9.2% for non-certified funds). The difference is mainly in the top decile of the most polluting investments. If we strip out the 10% of the most polluting investments - they represent just over 80% of the carbon content of investments - the carbon intensities between certified and non-certified are equal. Similarly, fossil fuel companies (Sources: Urgewald's Global Oil and Gas Exit List (GOGEL) and Global Coal Exit List (GCEL)) are less present in the portfolios of SRI funds: their weight is 35% lower than that of non-certified funds.

Certification excludes the least green funds, but does not guarantee environmental excellence
While certified funds are on average greener than non-certified funds, this does not mean that the SRI label divides the fund population into "green" and "non-green".
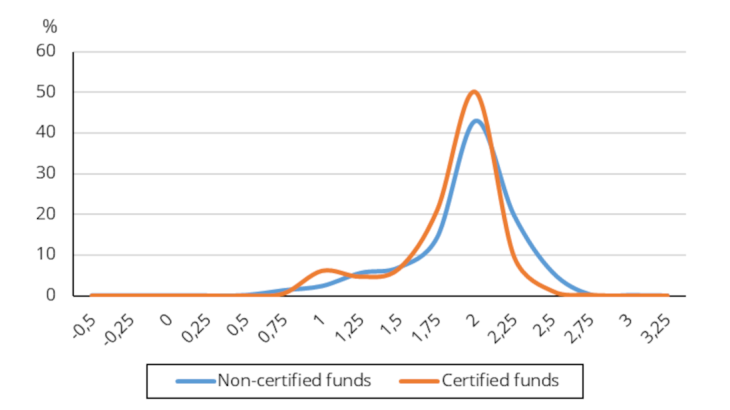
Indeed, first from an analytical point of view, the way in which certified and non-certified funds are distributed according to the average carbon intensity of their portfolios appears to be relatively similar, although not identical (distribution weighted by assets under management, see Chart 3). For instance, a euro randomly selected from the consolidated capital of certified funds has a 40% risk of being "less green" - in terms of the portfolio it represents - than a euro selected from the capital of non-certified funds.
Second, from the point of view of an investor choosing a certified fund and a non-certified fund at random (uncertainty not weighted by assets under management), there is a 47% risk that the certified fund will be "less green" than the non-certified fund. However, the selected certified fund would be three times less likely to be in the top decile of "least green" funds than the non-certified fund. It is therefore once again only at the upper end of the distribution, i.e. by stripping out the most polluting funds, that certification seems to have the greatest effect.

SRI certified funds are therefore not "green" in absolute terms, but they are "greener" than non-certified funds. This finding is consistent with the general purpose of a type of certification emphasising the notion of "responsibility", but does not necessarily correspond to the public's perception of the principle of certification recognising a form of "excellence".
Following the review and analysis of SRI certification by the Inspection générale des finances (Inspectorate General of Finance), and the submission of a report in January 2021, the Minister of the Economy, Finance and Economic Recovery launched a process to reform this certification in March 2021. In October 2022, the certification committee presented proposals on the objectives and ways to improve standards (available on lelabelisr.fr). In sum, to enable certification to play a role in fostering and accelerating a more sustainable economy, requirements should be enhanced to encourage funds that have already been certified to take more ambitious steps - at the risk, otherwise, of losing their certification. Reinforcing the climate dimension of the SRI certification could be achieved by excluding coal and non-conventional fossil fuel industries (such as shale oil and gas), or by publishing a transition path to achieve carbon neutrality by 2050.
Updated on the 25th of July 2024