No post 417. We present a new “financial impulse index” (FII) for the euro area that aggregates changes in key financial variables based on their impact on real GDP growth. The FII suggests that financial impulse has now returned close to neutral.
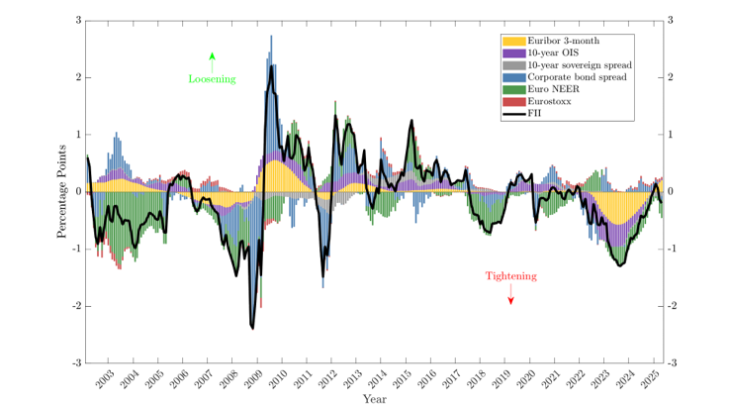
Chart 1: Euro area financial impulse index

Financial conditions indices (FCIs) are commonly used tools that summarise information from a broad range of financial variables— such as interest rates, stock prices, and exchange rates — into a single indicator. FCIs are a useful, real time tool for policymakers, in that they extract essential information from different, and sometimes conflicting, financial market movements. However, building FCIs is inherently challenging, as it is often unclear which variables to consider and how to weight them.
Following the work of Ajello et al. (2022) for the United States, we develop a new summary measure of financial conditions for the euro area that aggregates changes in key financial variables based on their expected effect on future real GDP growth. The variables span market segments that are most relevant to monetary policy transmission. Unlike traditional FCIs, which typically aim at benchmarking the level of financial conditions, our index focuses on their dynamic changes and how these changes are likely to affect GDP growth in the future. As such, our measure does not provide an interpretation of whether conditions are tight or loose at a given point in time, but rather whether their past and current developments are expected to add (subtract) growth. We label our measure the “Financial Impulse Index” (FII).
Construction of the euro area FII
Our variables include short and long-term risk-free interest rates (the 3-month Euribor and the 10-year OIS), stock prices (the Euro Stoxx 600), corporate and sovereign spreads, and the euro nominal effective exchange rate (NEER-41). The weight assigned to each component reflects the impact that a given change in the underlying variable is expected to exert on real GDP growth one year ahead. The weights are derived from Banque de France models.
Our FII differs from the existing Banque de France FCI of Petronevich and Sahuc (2019) in three ways. First, their index includes a broader set of financial variables in levels, while we focus on changes in a smaller set of variables. Second, the weights they assign to these variables are based on common factors that drive their financial variables, rather than on the variables’ impact on expected future real GDP growth. Finally, their weights vary over time, whereas our weights are fixed.
Chart 1 shows the evolution of the euro area FII and its components. A positive (negative) value of the FII indicates tailwinds (headwinds) to real GDP growth. For example, a value of 1 indicates that changes in financial conditions increase future GDP growth by 1 percentage point. Likewise, a rise (decline) in the FII indicates a loosening (tightening) of financial conditions.
Financial conditions in the euro area
As shown in Chart 1, the global financial crisis of 2007-8 saw a sharp tightening of financial conditions in the euro area, driven by a substantial rise in corporate spreads and the NEER appreciation. Subsequently, a normalisation of the corporate spread accompanied by the rapid fall in short-term interest rates considerably loosened financial conditions. Financial conditions tightened again rapidly at the time of the sovereign debt crisis in 2011, mainly driven by an increase in sovereign and corporate bond spreads. The accommodative monetary policy thereafter led to some easing of financial conditions over the 2014-18 period. The pandemic caused a sharp but short-lived tightening, mainly via falling stock prices and rising corporate spreads.
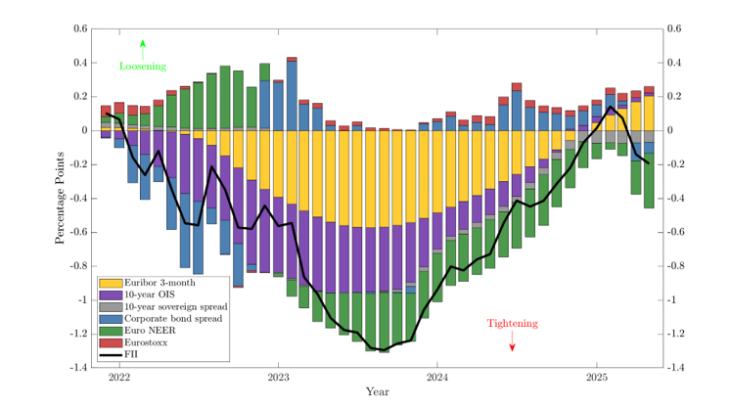
Chart 2 focuses on the changes in the financial conditions impulse since the start of the recent hiking cycle in 2022. The FII shows a rapid tightening of financial conditions in line with the policy rate hiking cycle. Since the peak of the tightening cycle at end-2023, conditions have loosened considerably, with the FII being back to its 2021 levels.
During the 2022-23 rate hiking cycle, most of the drag from financial conditions came from the interest rates and the euro appreciation. However, as short- and long-term interest rates began to stabilise in the second half of 2023, their contribution to the FII started to diminish. A drop in corporate bond spreads helped ease financial pressures. As a result, financial conditions gradually loosened compared to the trough seen at the end of 2023, and their impulse on real GDP growth is now in neutral territory. The slight tightening recorded in Q2 2025 mainly reflects rising corporate bond spreads and the euro appreciation following the US trade tariff announcements and the associated policy uncertainty
Chart 2: Euro area financial conditions since December 2021

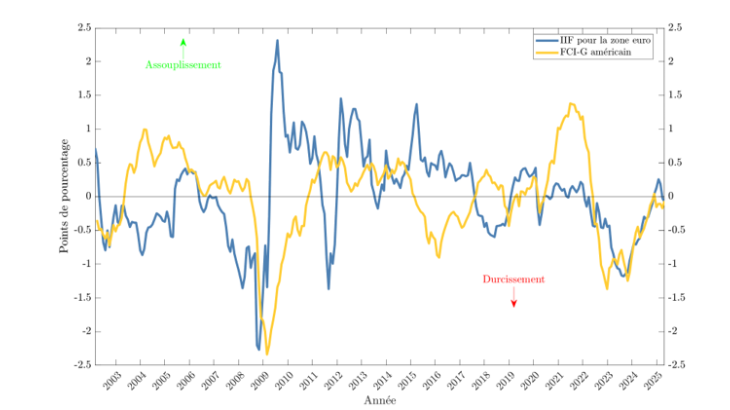
Chart 3: Comparison between euro area and US measures

Note: Last observation February 2025 for US and June 2025 for EA. Both measures are demeaned for comparability.
Comparison with the US
Chart 3 plots our euro area FII together with the Federal Reserve “Impulse on Growth” measure (FCI-G) developed by Ajello et al. (2022) for the United States. Both measures reflect the rapid tightening of financial conditions during the financial crisis and the recent hiking cycle. However, recent developments receive different interpretations.
Chart 4 plots the decomposition of the US FCI-G since the start of the recent hiking cycle in 2022 (source: Ajello et al. (2022)). The rise in short-term interest rates, the dollar appreciation and a rise in corporate bond yields led to a tightening of financial conditions. Conditions have eased since 2023, but unlike in the euro area, the stock market component played a major role in this loosening. As a caveat, the euro area and US measures are not fully comparable due to differences in their composition. In particular, the Fed’s FCI-G includes mortgage rates and house prices, while the euro area FII does not, reflecting the lack of high-frequency aggregate data for those variables.
Chart 4: The US FCI-G since December 2021

Download the full publication
Updated on the 12th of November 2025