In order to contribute to the national and European economic debate, the Banque de France periodically publishes macroeconomic forecasts for France, constructed as part of the Eurosystem projection exercise and covering the current and two forthcoming years. Each publication comprises a summary of the projections. Some also include an in-depth analysis of the results, along with focus articles on topics of interest.
Introduction

• Following a contraction in the first and second quarters of 2020, French GDP is expected to pick up in the second half and continue to improve in 2021 and 2022.
• These projections, which were finalised on 25 May 2020, are based on the assumption that Covid-19 will still be circulating during the coming months but that France, which has been affected in a similar way to other world economies, should gradually adapt. Alternative scenarios are presented in Box 1. With regard to fiscal policy, these projections incorporate the specific measures announced by the government up to 25 May. They do not take into account any new measures announced since that date, including the supplementary budget law which will be set out on 10 June. The risks to our projections are particularly high, both to the upside and the downside: evolution of the health situation in France, the household saving ratio which is linked to confidence levels, etc.
• In the near term, due to the weak activity levels up to the end of the strict lockdown on 11 May and the gradual loosening since, as our latest businesses surveys published today show, we expect an extremely sharp decline in GDP in the second quarter of 2020. A gradual upturn is anticipated over the coming quarters, as economic activity adapts to the new environment. However, in annual average terms, GDP for 2020 should still be extremely badly affected, dropping by more than 10%.
• Following this very severe shock, the recovery is likely to be spread out over time. The forecast GDP growth rates for 2021 and 2022 are expected to be high at 7% and 4% respectively, but this should still mean that we have to wait until mid-2022 to return to the level of activity seen at the end of 2019.
• After initially being cushioned by the short-time work mechanism, the deterioration in the labour market should be delayed but significant. The unemployment rate could rise to a peak of over 11.5% in mid-2021, and then decline gradually to below 10% by end-2022.
• French headline inflation (HICP) should temporarily drop into negative territory at the end of 2020 due to the combined effects of lower oil prices and the fall in activity. It should amount to only 0.4% on average in 2020 before strengthening a little in 2021 and 2022, but remaining very modest in our baseline scenario.
• The government debt-to-GDP ratio is expected to increase very sharply as a result of this crisis, reaching around 120% of GDP, well above the euro area average.
Like the rest of the world, the French economy suffered a shock of unprecedented proportions in the first half of 2020
From January to March 2020, the Covid-19 epidemic spread across the world at an unexpected speed. Due to the lack of a vaccine and intensifying pressure on healthcare systems, many countries were forced to take drastic measures to slow the advance of the virus. As a result, the shock to world economic activity was brutal, and it plummeted in the first half of 2020. In the euro area, where most countries imposed lockdown measures, GDP dropped by 3.8% in the first quarter and, according to the most recent Eurosystem projections, should fall back by a further 13% in the second quarter.
France introduced a strict lockdown in mid-March. In our business assessments published at the start of April and May, we estimated an immediate reduction in activity of around 32% during the two weeks of lockdown in March, and then of around 27% in April. According to INSEE’s second estimate of the quarterly national accounts, published at end-May, GDP fell by 5.3% in the first quarter of 2020.
The decline in GDP will mechanically intensify in the second quarter, which covers six weeks of lockdown until 11 May followed by a very gradual exit. Therefore, there will be a far greater loss of activity compared with the average recorded in the first quarter, which only included two weeks of lockdown (see Chart 1). In our projections, GDP in the second quarter of 2020 is thus expected to decline by a little over 15% versus the first quarter.
This second-quarter trajectory was finalised on 25 May. It is consistent with the economic information that has since become available, particularly the Banque de France surveys published today, which suggest a loss of activity of 17% at end-May, coming back to a loss of around 12% at-end June. Furthermore, these projections were constructed on the basis of the INSEE quarterly accounts published at the end of April and do not take into account the detailed first-quarter accounts (together with the annual accounts for 2019) which were published on 29 May and in which GDP growth was revised upwards from –5.8% to –5.3%. Given the size of the decline expected in the first half, this revision would only have a marginal effect on our projections.

Assuming reduced but continuing disruptions during the second half of 2020, GDP for the entire year is expected to decline by more than 10%
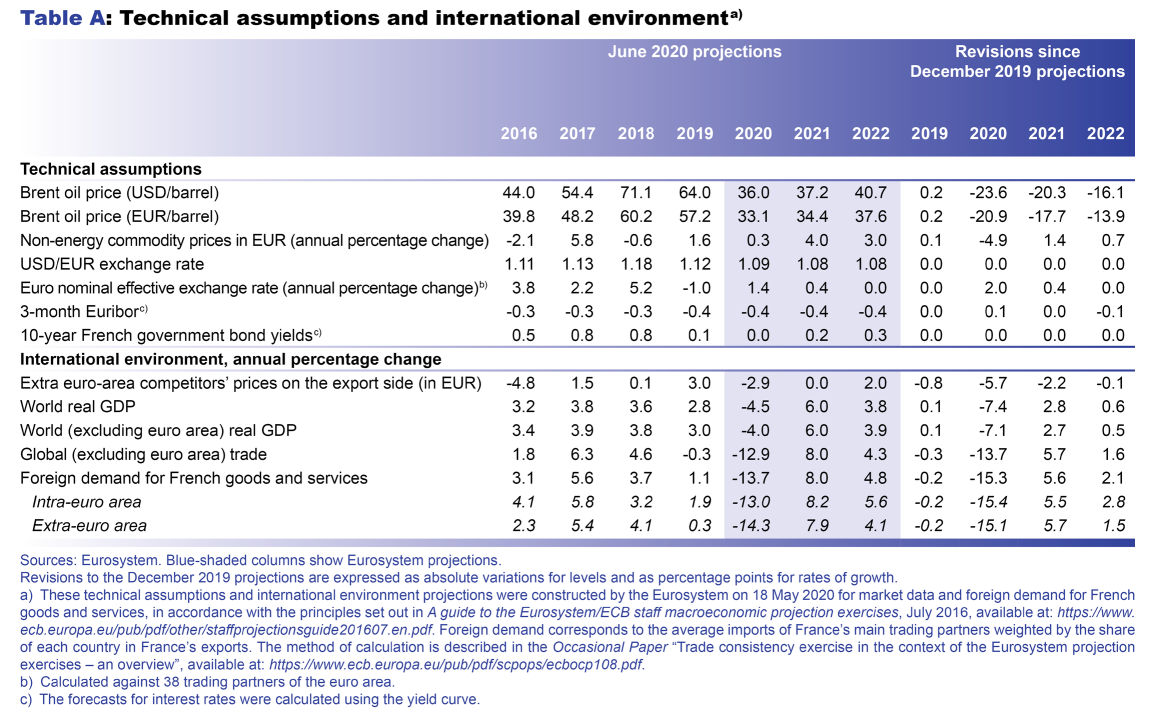
For the second quarter of 2020, we can still base our estimate of the loss of activity on available information, particularly that from our business surveys. Beyond this horizon, we have to apply assumptions. With regard to the international and financial environment (see Table A in the appendix), our projections are based on those of the Eurosystem, finalised on 18 May and published on 4 June for the entire euro area. After the economic and public health shocks that varied in their timing and scale at the beginning of 2020, the economic constraints associated with the circulation of the virus should become more uniform for the different euro area countries (see Chart 1).
In terms of public health and economic developments, we mainly apply two assumptions.
First, the virus will continue to circulate and therefore hinder the rebound in economic activity. However, we do not factor in any new deterioration that would necessitate reintroducing a strict lockdown.
Second, we assume that the improvement in the public health situation and adaptation of businesses to the new circumstances will mean that losses of activity compared to normal are gradually reduced despite the continued circulation of the virus. The example of certain countries where the initial economic shock was less severe can serve as a point of reference. We thus assume further losses of activity, compared with a no-crisis scenario, of around 10 percentage points in the third quarter and close to 7 percentage points in the fourth quarter of 2020. Under these gradual recovery conditions, GDP should fall by around 10% in 2020.
By way of illustration, and in line with the European Central Bank’s publication of 4 June, Box 1 presents a “severe” scenario, in which the disruptions remain more acute, and also a “mild” scenario, in which a more substantial reduction in the circulation of the virus by the end of 2020 should facilitate a return to a normal level of activity by the end of the year.
Box 1 : Alternative scenarios shed light on the key dynamics at play over the coming years
Alternative “mild” and “severe” scenarios: GDP growth could range from –7% to –16% in 2020
Our baseline projection is subject to a much higher degree of uncertainty than under normal conditions. To illustrate, this box presents two alternative scenarios – “mild” and “severe” (see chart). These scenarios were established within the framework of the Eurosystem’s preparation of its joint projections in June 2020 and are thus based on a coordinated approach with the analogous scenarios published by the ECB for the euro area and by certain national central banks for their domestic economies.
In the mild scenario, we assume that the circulation of the virus is brought under sufficient control to allow a more significant upturn across all economies. This public health success could result from the effectiveness of the initial lockdown measures or rapid medical breakthroughs in the detection or even treatment of Covid-19 and would heavily influence the behaviour of all economic agents. Activity in France would continue to be affected during the summer of 2020 by certain restrictive measures, but these could be relaxed relatively quickly such that the economy would return to its pre-crisis trajectory at the beginning of 2021. GDP would still decline markedly in 2020 but the rebound in 2021 would be very strong (see table). And in 2022, GDP growth would be close to potential, reflecting a return to normal. Inflation would be weak in 2020 under the mild scenario, but would rebound more markedly in 2021 and 2022, rising towards 2%.
In the severe scenario, on the other hand, we assume that the virus continues to circulate in France and around the world with a high degree of virulence. Domestically, following the easing of the strict lockdown on 11 May, strong public health measures could be needed to prevent another serious peak in Covid-19 related deaths. In this event, the fall in GDP in 2020 would be close to 16% and the rebound in 2021 would be weak as a result of the shock in 2020: households and businesses would gradually adapt to these difficult circumstances but in mid-2021, activity would still be 13% below its pre-crisis trajectory. As it is difficult to predict a date for a possible “second wave”, this scenario is not presented in the form of a “W”, but rather tries to show the possible outcome as an “average”.
In this scenario, it is only in mid-2021 that medical breakthroughs facilitate a sharper upturn in activity. However, this upturn would still be constrained by the – by then more persistent – economic consequences of previous events. Lasting disruptions to the value chains and the sharp increase in business failures could put a strain on the global economic and financial system. Potential activity would also be severely and lastingly reduced. In this scenario, the amounts spent on exceptional measures following the loss of activity would increase compared with other scenarios. However, it should be noted that this scenario does not incorporate additional economic policy responses that could be put in place under these conditions and partially lessen the severity of the drop in GDP. In the face of the deterioration in activity, inflation could be markedly negative in 2021 and then broadly zero in 2022.
With a gradual pick-up in activity, real GDP should return to its end-2019 level in 2022 according to our baseline scenario
Even greater uncertainty surrounds the forecasts for 2021 and 2022 than for those of the second half of 2020. They are based on the assumption of a gradual exit from the crisis. We anticipate GDP growth of around 7% and 4% in 2021 and 2022 respectively (see Chart 1). Despite this ostensibly sharp upswing, activity is not expected to return to its end-2019 level until mid-2022. Both 2021 and 2022 are thus expected to be years of marked but gradual recovery. Growth should then ease, returning to its potential rate beyond our projection horizon.
In 2021, the very sharp annual average improvement in activity should mainly be linked to the expected upturn in the second half of 2020 after the shock during the first half of the year. The growth carry-over for 2021 is thus already expected to be almost 5% at the end of 2020. The recovery should continue through the beginning of 2021, assuming that the economy continues to adapt to the public health constraints.
Growth in activity is expected to strengthen from the second half of 2021. In keeping with the Eurosystem’s projections for the euro area, we assume that in mid-2021, medical breakthroughs will mean that public health measures can be lifted. Household and business confidence would thus improve and the upturn in activity begun at the end of 2021 would continue into 2022, buoyed by a declining household saving ratio (see below). This would give a further boost to annual growth in 2022.
However, the loss of activity is expected to remain considerable at the end of 2022, at around 3 percentage points compared with a pre-crisis projection. This loss should partly reflect a shortfall in demand, but also a reduction in potential activity as a result of the crisis. On the one hand, the fall in investment should limit capital accumulation. On the other, we assume that the shock to the labour market and business failures will affect the economy’s overall productivity (see below). The loss of activity should thus break down approximately equally between potential GDP losses and a widening of the output gap. Beyond this loss in terms of level, potential growth should however be unaffected.
The balance between saving and consumption will be significant in determining the pace of the economic recovery up to end-2022
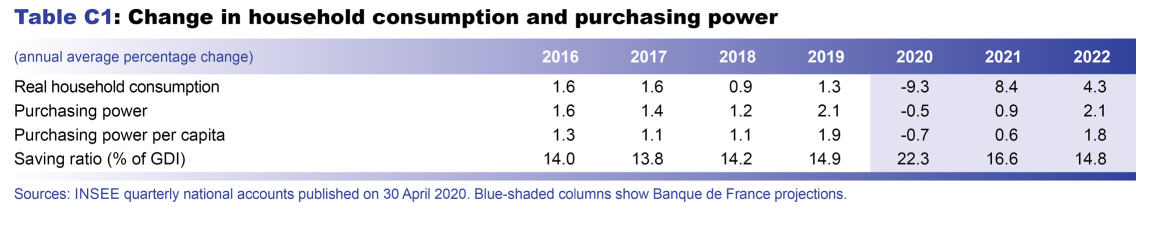
The lockdown measures at the start of 2020 imposed very tight constraints on household consumption. When combined with the relative resilience of incomes (see below), this means that the household saving ratio should increase sharply. It could thus be close to 20% for the first quarter and peak at around 30% in the second quarter, compared with an average of approximately 15% in 2019.

Since the relaxation of the lockdown, restrictions have only been gradually lifted and household consumption is still partially constrained. It is also likely that the expected rise in unemployment and the general context of deep uncertainty will continue to weigh on purchasing behaviour. In these circumstances, even though the saving ratio may decline sharply from the second half of 2020 onwards, it should nevertheless remain unusually high. It is thus expected to reach 22.3% in 2020, consistent with a 9.3% drop in consumption during the year. Household saving for 2020 should therefore be EUR 100 billion higher than anticipated in our pre-crisis projections. This largely “forced” increase in saving would be one of the accounting counterparts to the sharply rising government deficit (see below).
For the purposes of these projections, we assume that only the discovery of a lasting medical solution in mid-2021 will restore enough confidence to households for them to reduce their saving ratio more markedly. The saving ratio is thus expected to settle at a little over 16.5% in 2021, which is a similar level to that observed in 2009. In 2022, the average should drop below 15%, which is a little lower than would otherwise have been expected given the macroeconomic environment.
This saving trend should mean that consumption improves more rapidly than GDP, rising by 8.4% in 2021 and by 4.3% in 2022. The use of 2020’s forced savings should however remain limited due to the precautionary saving behaviour that can be expected in a deteriorated and uncertain economic context, with lower incomes than prior to the crisis and rising unemployment. If, on the other hand, the savings are used more quickly, from the second half of 2020 for example, this would above all result in a boost to annual average GDP growth for 2021 (see Box 2).
Box 2 : A major issue at stake for the strength of the rebound in activity, especially in 2021: the fall in the household saving ratio
After the sharp rise in household saving in the first half of 2020, we assume that the household saving ratio will decline very gradually until a lasting medical solution is found in mid-2021. As a result, the saving ratio should not fall back to its pre-crisis level until the start of 2022, and the additional savings accumulated in 2020 should only be consumed to a very limited extent. However, there is still a possibility that households will consume their accumulated savings more rapidly, and that the saving ratio will thus return to below its pre-crisis level at an earlier stage and remain there for longer (see chart). We therefore describe two variants here.
In the first variant, we assume that the public health restrictions quickly have less of a dampening effect on household consumption, and that the latter rebounds markedly from the end of 2020 onwards. The saving ratio is expected to fall rapidly below its long-run average and consumption should rebound sharply enough to exceed its fourth-quarter 2019 level as of the end of 2020. Under these conditions, GDP growth could be revised upwards by 1 percentage point in 2020 and by 1.5 percentage points in 2021. This variant corresponds to what would happen in the mild scenario described previously.
In a second, intermediate variant, we assume, in line with our baseline scenario, that household confidence only improves enough to trigger a clear drop in the saving ratio with the discovery of a vaccine over the course of 2021. However, we also assume that the drop from that point onwards is stronger than in our baseline scenario. Under these conditions, GDP growth would be unchanged for 2020, but the recovery in 2021 would be nearly 2 percentage points stronger, with GDP growth of close to 9%.
The shock to activity should lead to a fall in jobs
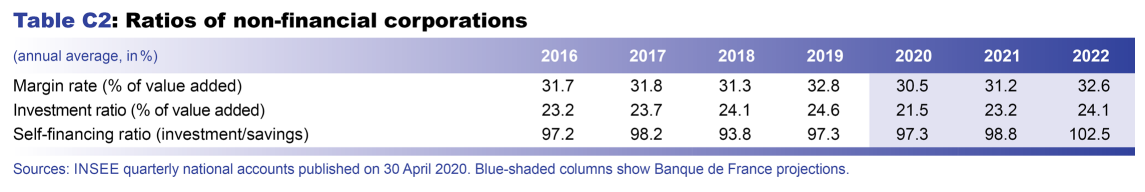
As a result of the economic shock at the beginning of 2020, businesses are having to cope with a brutal deterioration in their activity and their accounts. In 2020, they are expected to see the sharpest decline in their profit margin rate and saving ratio in over 40 years. This is expected to prompt a considerable fall in jobs.
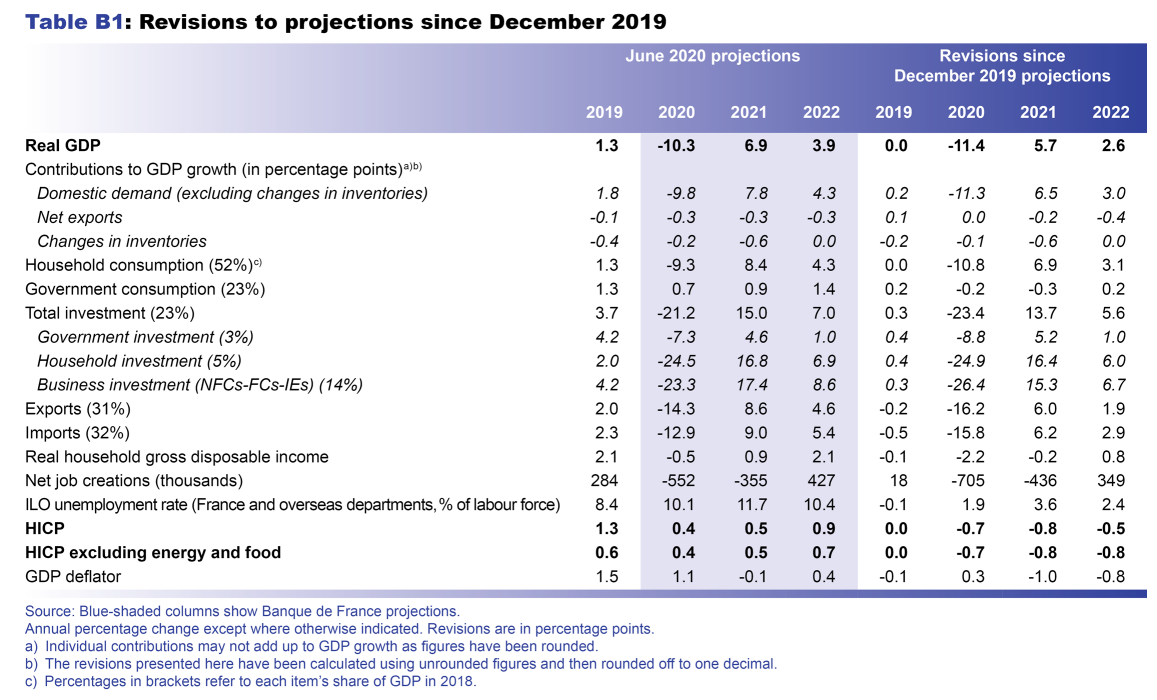
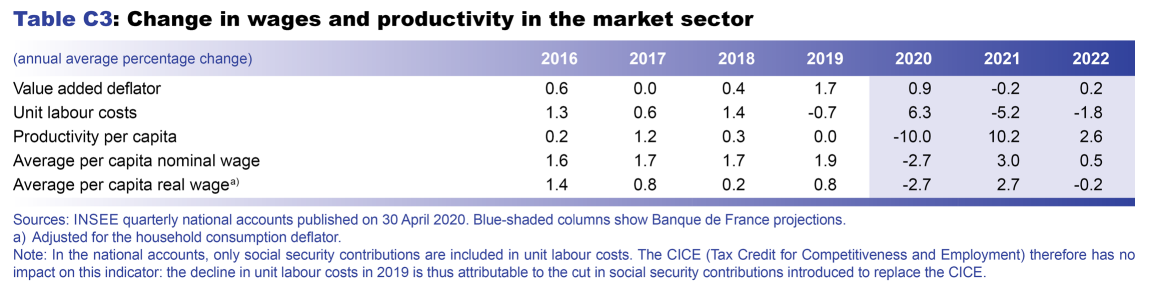
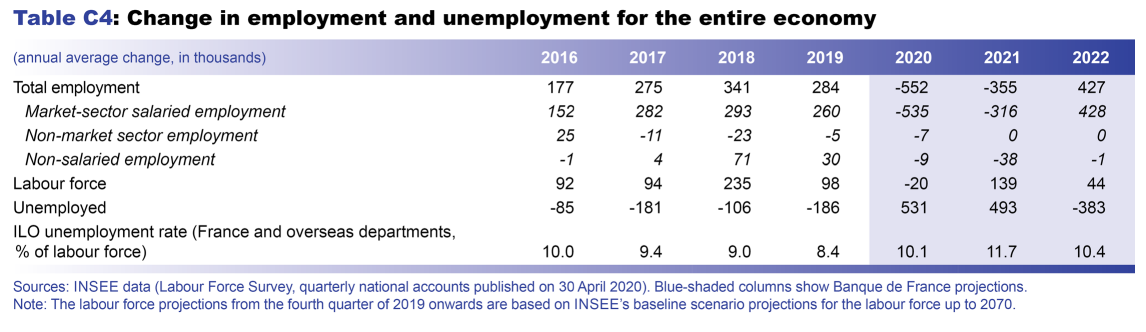
Since mid-March businesses have widely resorted to the short-time work mechanism, which has helped them to reduce their costs very significantly. Nevertheless, the labour market has already started to adjust: according to initial estimates published by INSEE, market-sector salaried employment was down by 2.3% at the end of March compared with the end of December 2019 (453,800 fewer positions, of which more than 290,000 were in the temporary-work sector). In the fourth quarter of 2020, the total number of jobs is expected to be almost 1 million lower than at the end of 2019 (see table).
These very high figures nevertheless demonstrate a degree of resilience in employment, as it does not follow the sharp V-shaped trajectory projected for GDP (see Chart 3). This resilience should partly be due to the effect of the short-time work mechanism. We assume that the number of jobs subsidised through short-time work compensation will peak at around 7 million in May and then gradually decline over the rest of the year. However, the resilience should also reflect the customary time lag in the adjustment of employment to activity. Under these conditions, the corporate margin rate should fall in 2020 and firms should therefore shoulder a larger share of the loss of national income than they would normally (see Box 3).

Employment should stabilise in 2021, lagging behind the rebound in activity, and should only begin to recover in 2022 (see table). The correction in employment and upturn in activity should then lead to an improvement in the corporate margin rate and a reduction in firms’ share of the overall loss of national income (see Box 3). In our projections, the adjustment in employment over the projection horizon (to end-2022) is expected to be slightly smaller than for GDP (see Chart 3). Indeed, in our projections we assume that the sharp contraction in activity will lead to long-term productivity losses, as was the case during the 2007-08 crisis. This assumption remains subject to significant risks, both on the upside (possible cleansing effect on the least efficient companies, more rapid spread of digital technology, etc.) and on the downside (potential under-investment, economies becoming more closed, unviable companies continuing to operate, etc.).

Following a time lag, the unemployment rate is expected to peak at over 11.5% in mid-2021before declining significantly thereafter
The deterioration in employment should mechanically affect the unemployment rate. The INSEE unemployment rate for the first quarter of 2020, published in mid-May, was 7.8%, down 0.3 percentage point on end-2019. However, as INSEE pointed out, this modest decline in unemployment (according to the ILO definition) is deceptive. The time spent in lockdown by jobseekers means that it is particularly difficult to estimate unemployment using standard statistical measures and classifications. The unemployment rate should thus rise rapidly in the coming quarters and peak temporarily at over 11.5% in mid-2021 (see Chart 4), above previous historical highs. It should then come back down to 9.7% by end-2022.
It should be emphasised that our forecast for the unemployment rate assumes that the behaviour of the working-age population will remain unchanged whereas in reality it could be affected by the crisis. This represents a major uncertainty as (i) some people may be discouraged from seeking work or may put back entering the workforce by extending their studies, for instance, and (ii) losses of household income could drive greater job-seeking, for example by the second partner in a couple that initially only had one earner.

Average losses in household income due to the shock are expected to be limited in 2020, but subsequent increases in household gross disposable income should also be constrained
Household income purchasing power is expected to decline by 0.5% in 2020 (down 0.7% per capita). Of course, these figures are averages covering situations that differ significantly depending on the household category, particularly as the labour market correction is initially expected to significantly affect those with the most casual employment contracts.
The decline in household income purchasing power in 2020 will be limited, and much smaller than the fall in GDP over the year (see Chart 5). First, public transfers (see below), through the interplay of automatic stabilisers and government-implemented measures, are limiting the losses in household income (see Chart 6). Second, the relative resilience of employment with respect to the shock to activity (discussed above) should cushion the shock to household income in 2020 (see Box 3).
However, although household income is currently relatively shielded from the crisis, this should weaken over time as the labour market adjusts. Purchasing power is thus expected to rise by 0.9% in 2021 and then by 2.1% in 2022. The figures are significant, and even decidedly high for 2022, but they should be outpaced by the rebound in activity over the same period.


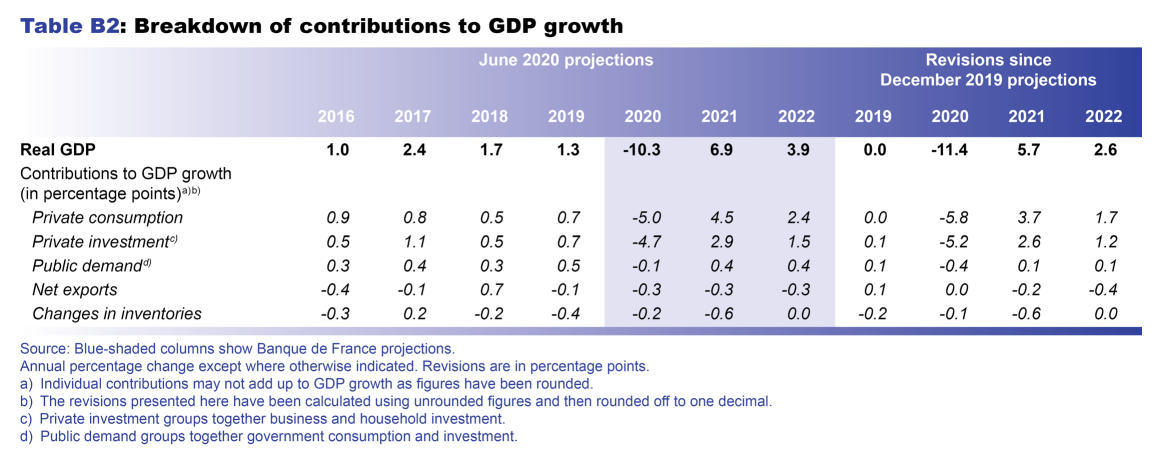
As is often the case, export and investment cycles are expected to be more pronounced than the GDP cycle
While household consumption should decline by a relatively similar proportion to GDP in 2020, the drop in exports (down 14%) and in total investment (down 21%) should be markedly greater.
Exports should follow the profile of foreign demand for French goods and services, which is expected to be very similar to that of our own imports. Indeed, most major economies have been hit simultaneously by the epidemic. This is particularly true of our euro area trading partners, whose activity is expected to follow a trend that is qualitatively akin to that of France, with a sharp drop during the first half of 2020, followed by a snapback in activity in the second half and then a slow and only partial catch-up in 2021 and 2022. According to the most recent Eurosystem projections, euro area GDP should fall steeply by 8.7% in 2020 then bounce back by 5.2% in 2021 and by 3.3% in 2022. Under these conditions, the net contribution of foreign trade to GDP growth should be stable and close to zero each year.

In contrast, the adjustment in business investment should be far more rapid. After the abrupt slump seen in the first half of 2020 (see Chart 7), which was amplified by the shutdown of nearly all construction activity in the first weeks of the lockdown, it should recover again very rapidly as economic activity picks up in the second half of 2020. It should then rise more gradually thereafter. Over the full year 2020, business investment is expected to fall to a much greater extent than GDP (drop of 23%), as is typical in business cycles. In the longer run, and given the uncertain economic environment, the investment ratio, albeit high at the end of 2022, should still be below its end-2019 peak. In addition to business investment, investment by households, and to a lesser extent by general government, should also by badly hit by the stoppage of building works. The overall weakening in activity should lead firms to run down their inventories, a trend that should mainly be visible in the annual average figures for 2021 (contribution of around –0.6 percentage point to GDP growth).
Box 3 : Insights into the distribution of the losses in national income during the crisis
The economic crisis and resulting drop in GDP represents a loss of income for the nation. An assessment of how this income loss is distributed between economic agents – businesses (non-financial and financial corporations or NFC-FCs), households and general government – shows that a number of macroeconomic mechanisms are at work.
For the purposes of this box, we look at gross disposable income. In the national accounts, gross disposable income is the balance of income and expenditure, which is used to fund final consumption (for households and general government) and investments (for all agents). For the nation as a whole, disposable income is almost equal to GDP. In 2019, that is under normal circumstances, households had 61% of total income at their disposal, general government 24% and businesses (NFC-FCs) had 13%. The remaining 2%, which is negligible for our purposes, was accounted for by non-profit institutions serving households (NPISH).
The chart shows how the loss of income suffered by the French economy in 2020, and then cumulatively for the 2020-22 period, is shared between the different economic agents in our projections.
In 2020, general government shoulders more than 60% of the loss in national income, which is far greater than its usual weight in that income. This reflects the mass transfers put in place to cushion the losses of private agents, and the significant deterioration in the government deficit. Indeed, households account for only 15% of the loss in national income in 2020, which is well below their usual 61% share of that income. In addition, more than 40% of the fall in household income in 2020 is due to declines in the gross operating surplus generated by the self-employed. Businesses account for more than 24% of the losses, which is higher than their normal share in national income (13%). Despite the magnitude of the public transfers, particularly the short-time work mechanism and the solidarity fund, this does not offset businesses’ overall loss of activity and the stickiness in employment.
Over time, this “asymmetric” distribution of income losses is tempered slightly. The share incurred by general government declines marginally as the exceptional support measures are discontinued, but still remains far higher than the usual share of general government in national income, which is consistent with a lasting deterioration in the government deficit. The share of losses absorbed by households increases gradually as employment deteriorates. It amounts to around 25% of the cumulative loss for 2020-22. This figure is still far lower than households’ normal weight in national income, however, due to the effect of the automatic fiscal stabilisers. It is counter-balanced by the decline in the share attributable to businesses as the employment correction and upturn in activity take effect.
Inflation is expected to be weak over the entire projection horizon
The measurement of inflation during the weeks of lockdown is somewhat delicate, as certain transactions were simply not carried out. In addition, the public health and economic crisis may lead to temporary price pressures on a certain number of products and services. This is the case, for example, for HICP inflation for unprocessed food, which came out at 12.2% in April. Equally, the need for firms to implement certain health and safety measures will lead to increased costs in some sectors, which could be passed on to the final consumer.

Nevertheless, the macroeconomic forces driving inflation show a clear downward trend which should predominate in terms of the evolution of the general level of prices. First, the recent crash in oil prices should lead to a year-on-year fall in energy prices of almost 9% in the second quarter of 2020. This decline in input prices is expected to spread gradually to the non-energy components of inflation. Second, the deterioration in activity should weigh – as it normally does, but very heavily in the current circumstances – on the growth in prices.
HICP excluding energy and food had already dropped sharply at the beginning of 2020 (see Chart 8), with sizeable shocks particularly to transport services, accommodation, and catering and communication prices in April. It is expected to remain low over the entire projection horizon. With headline inflation remaining low worldwide, the prices of imported products are not expected to rise greatly. Domestically, the deterioration in the labour market is expected to weigh on inflation, particularly in services, and, given the magnitude of the demand shock, businesses are compressing their margins somewhat, at least in the near term.
With the sharp fall in energy prices and despite the substantial rise in food prices, French headline inflation (HICP) could temporarily drop into negative territory at the end of 2020 (see Chart 8) and prices should increase by an annual average of only 0.4% over the year, after 1.3% growth in 2019. Headline inflation should pick up somewhat at the beginning of 2021, reflecting the fading of the base effect caused by the sharp fall in energy prices. However, in our baseline scenario it is assumed that it remains generally low, rising to a rate of 0.9% at the end of 2022.
While the macroeconomic trend appears to be on the whole deflationary, we cannot rule out the possibility that the costs linked to the health crisis could be passed on to the final consumer to a greater extent than is assumed here, placing temporary upward pressure on inflation. This will of course depend on the general macroeconomic environment: firms should be more able to raise prices to reflect the additional costs incurred as a result of the health crisis if the macroeconomic environment is favourable than if, on the contrary, the environment suffers a sharp and lasting deterioration (see Box 1).
Government debt is expected to rise sharply to close to 120% of GDP in the period 2020-22
As a result of the Covid-19 epidemic and the resulting economic crisis, the government has used fiscal leverage to cushion the public health crisis’ impact on the economy and to increase the capacity for a recovery. These exceptional support measures [the projections presented here take into account the information contained in the initial budget law for 2020, the supplementary budget laws of March and April, and the 2020 stability programme, as well as the measures announced by the government and set out in sufficient detail up to 25 May (plan for the tourism industry) but do not take into account any additional measures announced since that date (plan for the automobile industry, etc.) or any possible future measures, including those that may be included in the supplementary budget law to be presented on 10 June], combined with the sharp slowdown in activity in 2020, will cause the government deficit to deteriorate markedly in 2020, to a projected 10% of GDP compared with 3.0% in 2019 (2.1% excluding the double accounting impact of the CICE−Crédit d’impôt pour la compétitivité et l’emploi or Tax Credit for Competitiveness and Employment−and the cut in employer contributions). A third of this deficit widening is attributable to the support measures, and the remaining two-thirds to the economic contraction. In 2021-22, the end of the exceptional measures and recovery in activity should allow the deficit to be reduced sharply, assuming no further legislative changes are introduced, to 6% of GDP in 2021 and then to 5% in 2022. The deficit should nonetheless remain larger than it was before the health crisis. As a result of the wider deficit and the fall in GDP, government debt should rise substantially to 119% of GDP in 2020, from 98.1% in 2019, and should scarcely decline over the rest of the projection horizon. The average debt-to-GDP ratio for the euro area should also increase in parallel, but to a more limited extent (to 101% of GDP in 2022, easing to 100% by end-2022).

In our projections, government spending (excluding tax credits) is expected to rise sharply by 4.3% in nominal terms in 2020 as a result of the support measures adopted by the government (mainly the short-time work mechanism, the exceptional healthcare expenditure and the solidarity fund). In parallel, taxes and social security contributions are projected to fall by 8.9% due to the contraction of output and, to a small extent, the cuts set out in initial 2020 budget law. In 2021-22, the recovery in activity should lead to a normalisation, and in 2022 the overall tax-to-GDP ratio should be close (slightly below) to the level expected before the crisis. As the exceptional government expenditures come to an end, the ratio of government spending (excluding tax credits) to GDP is projected to be 55.7% in 2022. The spending-to-GDP ratio should still remain around 2 percentage points higher than projected before the crisis.
Appendices
Read the appendices
Eurosystem technical assumptions
Revisions to projections since December 2019 and breakdown of contributions to GDP growth
Additional indicators
Download the PDF version of this document
Updated on the 25th of July 2024