Post No. 413. The average (statutory) tariff levied by the United States on its imports increased by approximately 14 percentage points between January and September 2025, giving an average rate of between 18% and 20%, depending on the calculation method used. This increase factors in all new tariffs applied during this period, including those announced on 1 August 2025, as well as exemptions. It is comparable historically to the Smoot-Hawley tariffs of 1930. The average tariff levied on imports from France is estimated to be approximately 11% in September 2025 – compared with 1.5% in January 2025 – if the commitments in the European Union's trade agreement with the United States are fully implemented.
An unprecedented rise in US protectionism since 20 January 2025
The increase in tariffs levied by the United States since President Donald Trump took office on 20 January 2025 is unprecedented in historical terms, both in its scale and in the speed with which it has been implemented. It is part of a broader return to US protectionism, which began during Donald Trump's first term in 2017 and continued during Joe Biden’s presidency. In September 2025, the cumulative increase in the average US tariff rate stood at 14 percentage points (Chart 1). This increase is calculated by weighting the new tariffs introduced between January and September 2025 by the weight of US imports in 2023 and 2024 (N-1 and N-2).
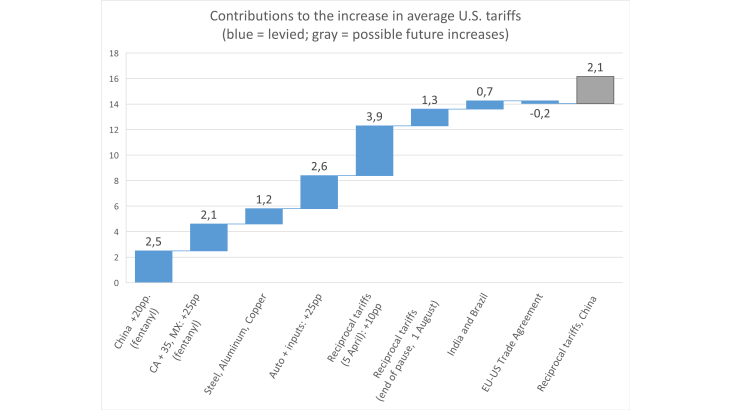
Chart 1: “Tariff tracker”. A cumulative increase of 14 percentage points in the average US tariff rate between January and September 2025.

Note: Each blue bar represents a contribution to the increase in the average US tariff rate. The grey bar corresponds to potential tariff increases that have been announced but not yet implemented (the chart includes an additional 24 percentage points for China from 9 November). These increases do not take account of the starting level of average US tariffs in January 2025, which is why the y-axis starts at 0. They should be interpreted as the “statutory” or “official” tariff increases, which may be lower due to possible circumvention and exemptions that would not be reflected in the tariff tracker calculations.
The tariff increases targeted China from March 2025 onwards (+20 percentage points (pp), Chart 1), resulting in a 2.5 pp increase in the average rate of tariffs on all US imports, as well as Canada (+35 pp) and Mexico (+25 pp), amidst accusations relating to fentanyl trafficking. Tariffs were subsequently levied on imports of steel and aluminium (two successive increases of 25 pp), as well as on automobiles and their industrial inputs (+25 pp). In August, fresh tariffs were announced for copper products (+50 pp) and the metal components in the value of over 400 manufactured goods. Finally, “reciprocal tariffs” (+10 pp) were applied on a symmetric basis to imports from all US trading partners from 5 April, with the exception of Canada and Mexico, before being increased from 7 August at rates that varied between countries (from +10 pp to +41 pp). Indian and Brazilian exports to the United States were also hit by tariff increases of 50 pp.
These cumulative increases in tariffs factor in exemptions related to compliance with the value-added component criteria set out in the United States-Mexico-Canada Agreement (USMCA), exemptions from tariffs on US value-added components in automobile imports from Canada and Mexico, and exemptions on electronics, pharmaceuticals, and aeronautics (under the European Union's trade agreement with the United States). These have helped to limit the increase in additional costs of imports to the United States, and therefore their impact on production or retail prices.
However, uncertainty remains regarding potential future tariff increases. A pause has been declared in the escalation in tariffs between the United States and China until 9 November. This uncertainty over future tariffs is illustrated in the grey bar in Chart 1: aside from the 14 pp increase since January 2025 (cumulative blue bars), average US tariffs could rise by a further 2 pp, taking the cumulative increase to 16 pp in November 2025 if the reciprocal tariffs that have been announced are actually levied in full.
An average “statutory” tariff in the United States of between 18% and 20% (in September 2025), compared to just under 10% for the average “effective” rate
The increase in US tariffs since the beginning of 2025 has put an end to a long period of falling barriers to trade that began at the end of the Second World War, resulting from post-war multilateralism. Research by Douglas Irwin (Dartmouth College and Peterson Institute) shows that US tariffs (calculated on total imports) had already reached very high levels in the past: 29.6% in 1890 under President McKinley, and 19.8% in the 1930s with the Smoot-Hawley Act. But they were then significantly reduced from the end of the Second World War against a backdrop of increased multilateralism.
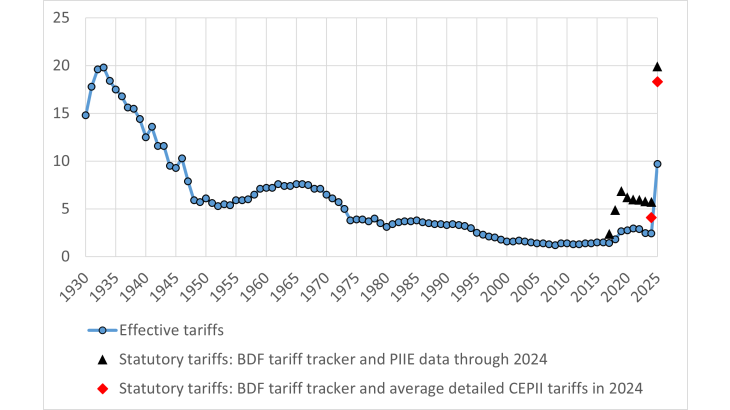
Data from the US Census Bureau (blue curve in Chart 2) can be used to measure the level of protectionism by calculating the ratio of customs revenues to total imports, by product and partner, or for all US imports. This corresponds to "effective” tariffs, i.e. those collected on imports into the United States, as opposed to de jure “statutory” or “official” tariffs. This is therefore an ex-post calculation, following changes to the structure of imports linked to the introduction of tariffs. In 2017, the average effective rate was historically low, at 1.4%. In September 2025, it had reached 9.7%.
While the level of “effective” protectionism in US Census data makes it possible to measure the short term risk of price increases in the United States, it underestimates the distortion caused by tariffs for several reasons. First, the shift in consumption towards products and suppliers that are not taxed, or taxed at a low rate, minimises the level of protectionism at the macroeconomic level. The effective tariff rate implicitly assigns more weight to low-taxed imports; it minimises the cost to consumers (or importing businesses) who have to reallocate their consumption. Second, exemptions granted to certain exporters can reduce the level of effective tariffs, even though these exemptions are associated with additional administrative costs and distort competition between businesses. Lastly, effective tariffs may be subject to a time lag in the event of a gradual application of new tariffs by the customs authorities.
.
Chart 2: Average rate of tariffs levied by the United States

Note: the blue curve is a historical series of effective tariff ratios, defined as the ratio between customs revenues and imports. This series is calculated using data from the US Census Bureau and Historical Statistics of the United States 1789-1945 through 2024, extrapolated using data from July 2025. The black triangles represent the statutory rate, i.e. the theoretical average tariff according to official texts. The statutory rate is determined from Banque de France calculations based on data from Chad Bown (US-China Trade War Tariffs: an Up-to-Date Chart, Peterson Institute for International Economics (PIIE), 2025) up to 2024, US government announcements, and customs data for 2025. The level of tariffs through 2024 is calculated as the average of US tariffs on China and on the rest of the world (PIIE), weighted by the proportion of these two regions in US imports in years N-1 and N-2. The red diamonds correspond to our measurement of statutory tariffs, combining detailed tariff data published by the Centre d'Études Prospectives et d'Informations Internationales (CEPII, the MAcMap-HS6 database) in 2024, weighted by proportion of trade in years N-1 and N-2, and tariff increases since January 2025 published in the Banque de France's tariff tracker.
For these reasons, our assessment of the average level of US economic protectionism in 2025 is based on "statutory” tariffs, weighted by average import flows for years N-1 and N-2 in order to mitigate the impact of the shifts in consumption described above. Our calculation is based on two weighting approaches. The first is based on tariffs levied on China and the rest of the world, calculated by the Peterson Institute for International Economics (PIIE, here) using the weightings of a benchmark group of countries rather than US imports (e.g. China's weight in global imports). This approach results in a higher level of protectionism than when using US Census data for 2024 (average rate of 5.8% in 2024). Adding the cumulative tariff increases since January 2025 from the Banque de France's tariff tracker, gives us a level of tariffs close to 20% in September 2025 (black triangles in Chart 2).
The second approach (represented in Chart 2 by the red diamonds) uses detailed customs duty data from the CEPII's MAcMap-HS6 database. These tariffs, observed for each product and US trading partner country, are then weighted by import flows for years N-1 and N-2, thus reflecting structural changes in imports (e.g. decline in China's share due to geoeconomic fragmentation). This gives an initial level of 4.1% in 2024. The level of protectionism observed in September 2025 stands at 18.3% after including the cumulative tariff increases in 2025 recorded in our tariff tracker.
Substantial heterogeneity in exposure to US protectionism
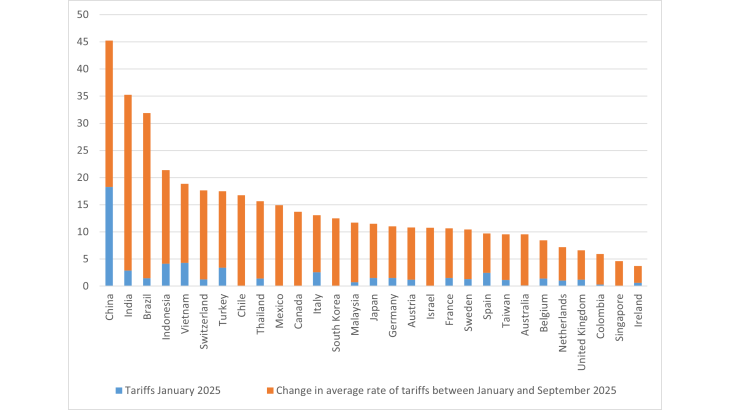
The average rate of tariffs levied on each of the United States' trading partner countries varies greatly (Chart 3). These variations stem from two sources: differences in rates between countries for the same goods, and differences in the sectoral composition of exports. Concerning the first point, China has been targeted by specific tariff increases since 2017. Concerning the second point, even before 2025, the United States protected certain sectors, such as textiles and agriculture, more than others, to the detriment of certain exporting countries such as Indonesia and Vietnam. Moreover, since January 2025, certain industries, such as steel, aluminium and the automotive sector, have been heavily targeted by hikes in import tariffs.
All in all, based on statutory tariffs weighted by imports (by product and partner country) in years N-1 and N-2, the tariffs levied by the United States on imports from China should amount to 45% in September 2025. In Europe, they should be close to 13% for Italy and 11% for Germany and France. Lastly, exporters of electronics, semiconductors (Taiwan, Singapore) and pharmaceuticals (Ireland) are expected to be less affected by the tariff increases due to exemptions on these products.
Nevertheless, this assessment remains subject to change due to ongoing uncertainties surrounding US trade policy, reflected for example in the announcements made on 1 August 2025 and in the trade agreements signed over the summer.
Chart 3: Average rate of tariffs levied by the United States by country of origin.

Download the full publication
Updated on the 29th of October 2025