- Home
- Publications et statistiques
- Publications
- Growth in global value chains has not co...
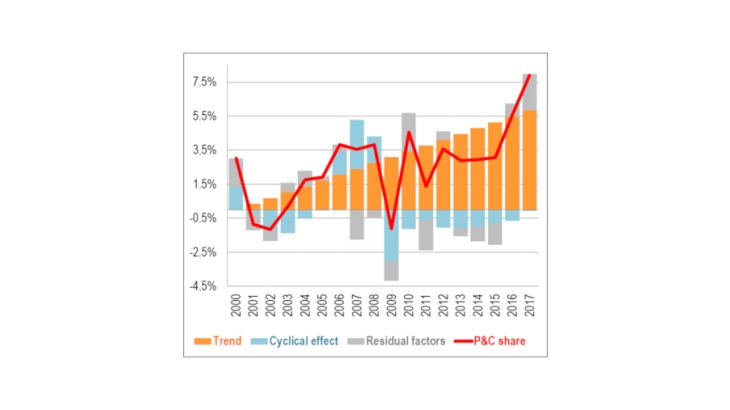
Post n°115. The weakening of global value chain dynamics is considered as one of the causes of the slowdown in world trade since the 2008 crisis. However, measured as the share of trade in parts and components in the volume of world trade, and given the evolution of the business cycle, the development of international value chains continued after the crisis.

Key: Each year the log of P&C share is the sum of the trend (set at 0 in 2000), the cyclical effect and a residual. From 2000 to 2017, the P&C share increased by around 5%.
Measured at current prices, the fragmentation of global value chains has declined since 2011 ...
In the 2000s and until the global crisis of 2008-2009, world trade grew about twice as fast as global GDP (see Gaulier, Steingress et Zignago, 2016). Since then, trade and output have on average grown at about the same pace. The weakening of global value chain (GVC) dynamics, following their boom in the 2000s, is often considered as one of the causes of the slowdown in world trade.
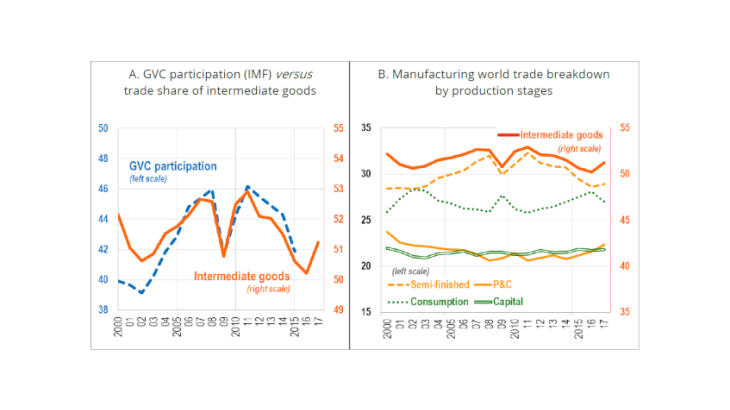
Identifying global value chains (GVCs) in the mosaic of international production processes is a difficult task. One of the most widely used methods combines inter-industry relationship matrices linking national output data to international trade. By drawing on a large number of national and international statistics, it is possible to monitor how several countries successively add their contribution to value added to produce a good intended for household consumption or for business investment. In the latest IMF World Economic Outlook, Eugster et al. (2019) use this approach to present the dynamics of international production networks. Their GVC participation indicator, which represents the share of world exports that cross at least two borders, increased from 2000 to 2011 (with the exception of a notable drop during the Great Recession). The development of GVCs then apparently came to a halt, before declining until 2015 (Chart 2A).
Like other authors (IRC Trade Task Force, 2016 ; Haugh et al., 2016), the measure we use (Gaulier, Sztulman et Ünal, 2019) links GVCs to the share of intermediate goods in world trade. These goods are not intended for final demand but incorporated into the production of other goods: intermediate goods "disappear" during the production process. The advantage of this measure of GVCs is threefold: its calculation is only based on trade statistics; it is therefore more readily available than indicators based on inter-industry relationship matrices; lastly, it may be adjusted for price effect-related variations. The changes in this measure are consistent with those of the indicators obtained from inter-industry trade tables (Chart 2A): the share of intermediate goods in world trade in value terms (orange line) increased in the 2000s, then declined until 2016. The indicator picked up in 2017 (a year for which the data are likely to be revised).

Notes: In panel A, the "GVC participation" curve shows the share of world exports that cross at least two borders; and that of intermediate goods in world trade in non-energy manufactured goods. The latter is also shown in panel B, together with its two components (semi-finished goods and P&Cs).
We continue the analysis by distinguishing, within intermediate goods, the parts and components (P&Cs) that are at the heart of GVCs and the semi-finished goods that are further upstream. The first group includes, for example, spare parts for machine tools and electronic components, and the second, chemical and steel products. The changes in the shares of the two production stages in world trade differ markedly (Chart 2B). The profile of the intermediate goods curve is largely shaped by the changes in semi-finished goods (yellow dashed line). Compared to semi-finished goods, the share of P&Cs in world trade (solid yellow line), far from falling, increased after the crisis.
… but increased at constant prices
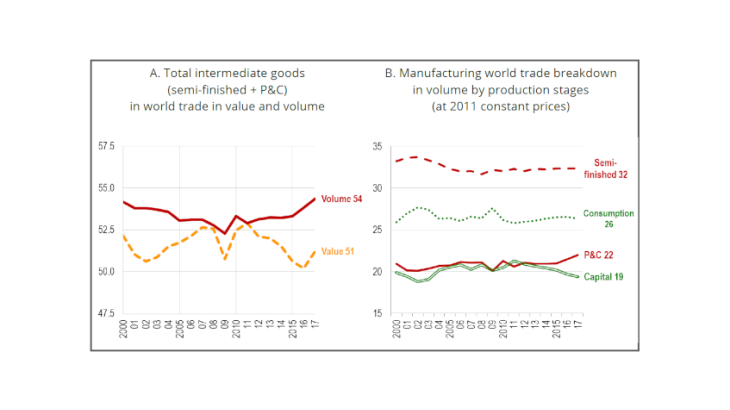
The granularity of available data enables us to adopt a novel approach that consists in calculating a measure of GVCs in volume terms taking into account the effect of price variations. For each production stage, deflators are constructed based on unit values, i.e. "value/quantity" ratios at a very fine level. Average prices for each stage show contrasting dynamics. These differences are due in particular to their degrees of incorporation of raw materials whose prices are very volatile: semi-finished goods, more upstream of the production process, incorporate a large amount of raw materials, and P&Cs relatively little.
The share of intermediate goods in trade in volume terms does therefore not follow the same trend as that observed in trade in value terms (Chart 3A). It decreased slightly until the Great Recession but has caught up since then. The initial dip can be attributed to its "semi-finished goods" component, while the more recent moderate growth is driven by the P&C component (Chart 3B).

P&Cs are particularly present in industries that are emblematic of what Baldwin (2016) calls the "second unbundling", i.e. the segmentation of production processes all over the planet, such as the automobile and electronics industries. It is this share of P&Cs in world trade in volume terms that we find relevant for measuring GVCs.
Until 2017, the share of P&Cs in the volume of world trade varies with the business cycle around a growing trend
Using an econometric estimate for the period 2000-2017, we break down the progression of our GVC indicator - the share of P&Cs in the volume of world trade - by distinguishing a linear trend, a cyclical effect and a residual (Chart 1 presented at the beginning of the post).
The influence of the business cycle is measured by the gap between the level of global GDP and its potential (i.e. production at full capacity utilisation). The regression highlights the pro-cyclical nature of our indicator: GVCs develop when business conditions are favourable; conversely, they slow down when global demand declines, possibly because the production stages in which the value added is low become less profitable.
Once the cyclical effects have been taken into account, the share of P&Cs in the volume of trade increases by an average of 0.34% per year. In 2017, the level of the indicator is even higher than expected. The residual gap (in grey) could be due to measurement errors but could also point to a faster development of GVCs.
Our indicator thus offers a different view of past GVC developments; regularly updated, it can contribute to the assessment of the future dynamics of GVCs at the heart of the globalisation process.
Updated on the 25th of July 2024