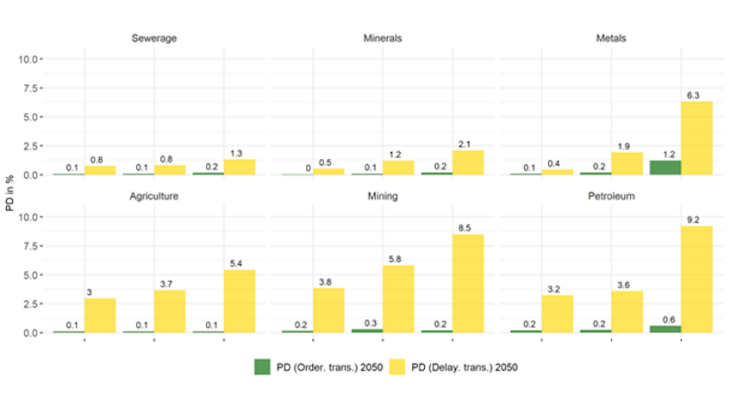
Note: From left to right the value of the PDs under an orderly and a delayed transition, for the first, second and third most affected company (with the largest difference between the PDs in the two transition scenarios in 2050).
Looking more specifically at some individual companies (the three most impacted companies for each sector), Chart 3 shows that some companies may reach an unsustainable level of PD in 2050, rising from 0.6% in an orderly transition scenario to over 9% in a delayed transition scenario. Among the very adverse consequences of this deterioration in credit quality for companies and credit institutions, it is worth pointing out that credit claims that are eligible as collateral for refinancing operations must have a PD below 0.4% in the permanent monetary policy framework and a PD below 1.5% if they are additional credit claims (ACC). A credit claim with a PD over 1.5% is considered ineligible for monetary policy operations, and PDs over 5% correspond to the worst level of credit quality.
Corporate credit spreads and financial asset prices
Climate change is a phenomenon that may have very significant effects on economic sectors, financial institutions and financial stability (NGFS). For these reasons, we focus here on the impact of transition scenarios on key financial variables such as corporate credit spreads and financial asset prices. The credit spreads of French non-financial corporations, and their projections, were determined from the probabilities of default provided by the Risk Management Institute of the National University of Singapore and the projections calculated, for each relevant scenario, by the Banque de France rating model. Based on the PDs over each relevant horizon and economic sector, the associated credit spreads were determined using the formula of Merton (1974) and Black and Cox (1976). Once the database of spreads had been compiled, projections were made, for each transition scenario, using a Gaussian VAR model with the following variables: corporate credit spreads, two macroeconomic variables (GDP growth rate and inflation rate) and the risk-free yield curve.
In order to study the impact of each alternative scenario, compared to an orderly transition scenario, two economic sectors can be compared: the non-cyclical consumption sector (NCC; agriculture, food, beverage and tobacco manufacturing, pharmaceutical industry and human health activities) and the fossil energy sector (FE; mining and quarrying, coking and refining).
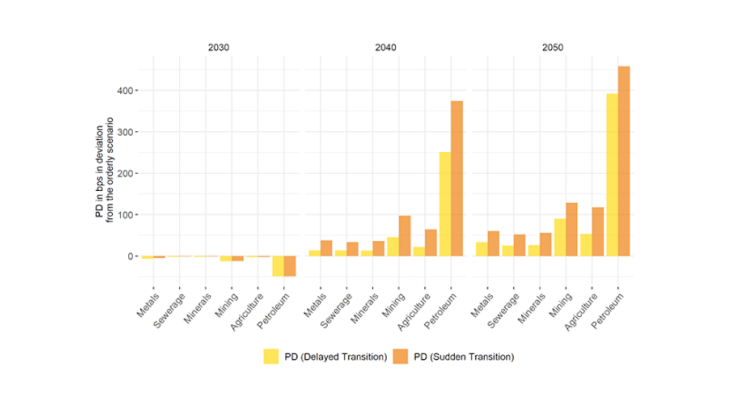
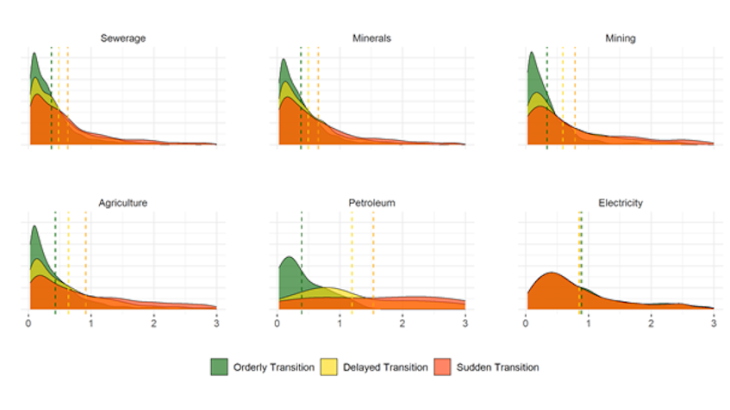
In deviation from the baseline scenario, and in line with the projections of the PDs presented in Chart 1, we observe that: a) the fossil energy sector exhibits larger expected changes in credit spreads than the NCC sector for each alternative scenario; b) the expected changes in the NCC sector are marginally affected by the two alternative scenarios (10bps and 15bps, respectively); c) in the delayed transition scenario, the expected changes in the credit spreads of the FE sector are slightly negative until 2035 and then become positive and reach values close to 25bps in 2050; d) in the sudden transition scenario, the expected changes in the spreads of the FE sector are negligible until 2030 and then reach almost 30bps in 2050.
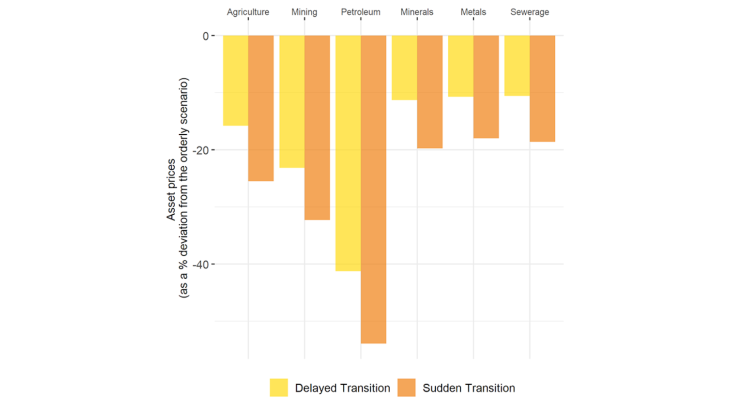
Stock market asset prices are determined using a model based on the sum of discounted flows of expected future dividends (Dividend Discount Model). These dividends are derived from the projections of value added (VA) determined according to the methodology mentioned in blog post 255. The discount rate is determined using the stock market index of the country under consideration, incremented by a risk premium component, identified, for each sector and scenario, by the associated corporate credit spread. Given an asset price for each sector and scenario, the relative change (in percentage terms) of the price in an alternative scenario compared to the baseline scenario determines the elasticity of the relevant asset. Chart 4 shows that if investors were to suddenly discover in 2020 that the future values of oil sector dividends were not those of the baseline scenario but those of a disorderly transition scenario (delayed or sudden), then the stock prices of this sector would appear to be overvalued - compared to the baseline scenario - by around 41% in the former case and 54% in the latter.


