Post n°340. For central banks to achieve their price stability objective, inflation expectations need to be anchored at the inflation target. The formation of these expectations depends on the amount of attention economic agents pay to inflation. Using data from social media and the press, we show that attention to inflation is not constant and depends on the level of inflation.
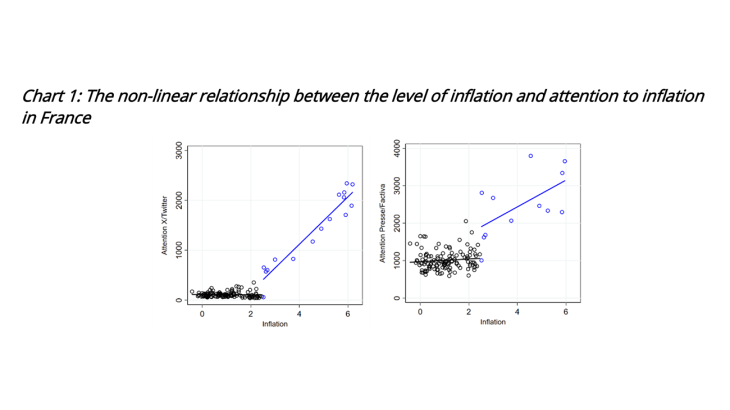
The sharp rise in prices in the past two years has raised legitimate concerns over purchasing power, and increased the amount of attention the general public pays to inflation. Public attention to inflation is not a directly measurable concept. However, one way of quantifying it is to measure the number of times inflation-related terms are used on social media or in the press. When inflation was low, the number of occurrences of these terms was also low and did not vary with the inflation rate. When inflation exceeded a certain threshold, the amount of attention it attracted also increased sharply and continued to rise as inflation increased (Chart 1).

Note: Y-axis: average daily number of tweets (left) and press articles (right) each month. X-axis: French inflation as measured by the HICP.
A non-linear relationship between attention to inflation and the inflation level
There is no consensus on the best way to measure attention to inflation, not least because it depends on the category of economic agent under consideration – households or firms, for example. In this blog post, we use a methodology developed and described in a previous Eco Notepad blog post (No. 299) and apply it to X (formerly Twitter) and to press articles (collected by Factiva). As a result, our measure of the attention paid to inflation focuses on social media users – both experts and the general public – and on journalists, whose aim is to respond to public expectations. These two indicators, X/Twitter and the press, measure the number of tweets or press articles published each month on the topic of inflation between 2011 and 2022. We then link these indicators to the level of inflation, as measured each month by INSEE, and find a non-linear relationship between the inflation level and the amount of attention paid to the topic in France, with a threshold at around 2.5% (Chart 1). Below this threshold, agents appear to pay little attention to inflation, whereas above it they are much more attentive to the issue. For each additional percentage point of inflation above the threshold, the level of attention increases sharply.

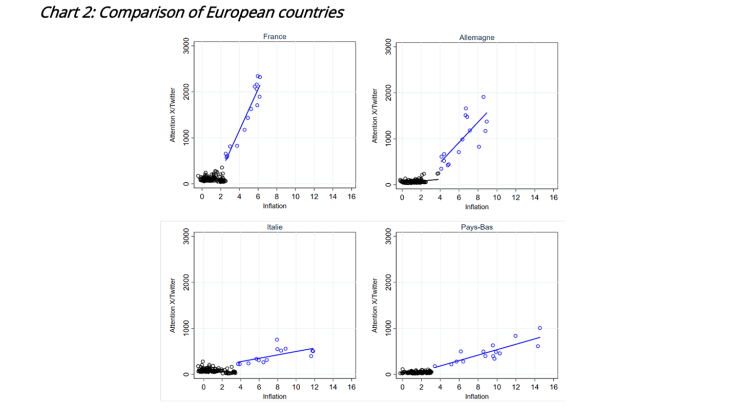
Note: Y-axis: average daily number of tweets each month in each of the 4 countries. X-axis: Inflation as measured by the HICP.
In Germany, Italy and the Netherlands, a similar non-linear relationship can be observed (Chart 2). However, the threshold above which attention to inflation rises and the intensity of the relationship beyond this threshold may vary from one country to another. For example, the intensity of the relationship between attention and inflation is much lower in Italy and the Netherlands than in France and Germany. This may be explained by cultural or institutional differences. Using a measure of attention based on the number of Google searches for the word “inflation”, Korenok et al. (2022) show that, in countries with historically high inflation rates, there is no non-linear relationship or the threshold for inflation exists but is higher. In countries where inflation has been low in past decades, the threshold is low (between 2% and 4%) and the relationship is very non-linear, as in France. These results suggest that the level of attention depends on the “usual” inflation environment. Weber et al. (2023) show that the amount of attention business managers and households pay to inflation varies significantly depending on the usual inflation environment in which they operate.
The frequency with which individuals encounter certain prices and changes in those prices in their daily purchases may also prompt them to pay closer attention to inflation (Banque de France Bulletin No. 249). Increases in food prices (D’Acunto et al., 2021) or in fuel prices (Binder, 2018) may lead them to pay more attention to price changes at a more aggregate level.

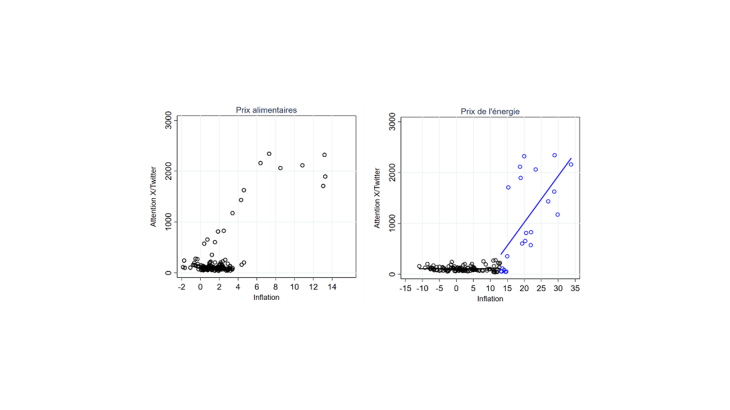
Note: Y-axis: average daily number of tweets each month. X-axis: food inflation (left) and energy inflation (right) in France.
Chart 3 suggests that energy prices make a bigger contribution to this heightened attention than food prices. How do these different signals affect the formation of inflation expectations? The literature has shown that agents give more weight to individual signals than to aggregate signals, which partly explains the dispersion of inflation expectations in household and business surveys (Eco Notepad blog post No. 285).
High inflation increases the attention paid to inflation
Why do economic agents’ attention levels vary with the inflation rate? Each day, economic agents receive large flows of new information on macroeconomic developments and on specific shocks, and make decisions based on this information. However, access to this information can be costly: it requires time and attention. It may therefore be rational for agents not to pay constant attention to all the information at their disposal. The degree of attention they pay to certain information and the frequency with which they have access to new information will then depend on the expected gains to be derived from the new information.
When inflation is persistently low and stable, it may be appropriate for economic agents to pay less frequent attention to the issue. Conversely, when inflation is high, it is in households’ and firms’ interest to monitor price changes closely to avoid losing purchasing power and to make consumption or price-setting decisions. The theory of rational inattention (Sims, 2003, and Mackowiak and Wiederholt, 2009) suggests that individuals choose to be inattentive because the cost of acquiring and processing information outweighs the benefits.
Shocks are transmitted more rapidly to prices when attention is high
When economic agents pay more attention to inflation, they take greater account of aggregate shocks in their price and wage-setting decisions. Conversely, when inflation is low, individual shocks carry greater weight than aggregate shocks. High levels of attention to inflation can therefore lead to a greater and faster pass-through of an inflationary shock to prices and wages (Pfauti, 2023, and Eco Notepad blog post No. 323).
In addition, when attention to inflation is high, central banks need to be more careful in communicating their monetary policy intentions and in managing inflation expectations, as the latter can be more responsive. Yet high attention levels can also be an advantage: as central bank communication potentially has more influence than when inflation is low, it could also enable monetary policy to have a bigger impact on inflation.

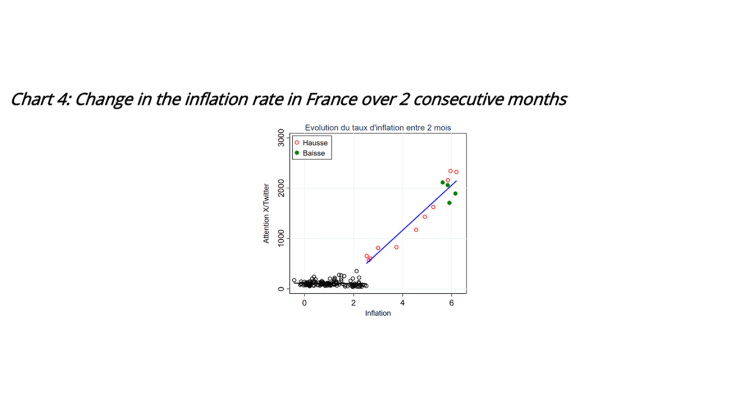
Note: Y-axis: average daily number of tweets per month. X-axis: French inflation as measured by the HICP. Red (green) circles: rise (fall) in the inflation rate, measured year-on-year, over two consecutive months.
Similarly, the mechanism whereby shocks are transmitted faster in a high attention environment can also be viewed symmetrically: when inflation is high, economic agents not only pay close attention to increases in inflation but also to decreases in inflation (Chart 4). Individuals are therefore likely to be more attentive to the first signs of a slowdown in inflation, and to transmit this lower inflation more quickly to the rest of the economy.
Download the PDF version of the publication
Updated on the 25th of July 2024