Eco Notepad

New indicators of perceived inflation in France based on media data

Published on 27 December 2022
Authors : Jean-Charles Bricongne, Olivier de Bandt, Annabelle De Gaye, Julien Denes, Paul Hubert, Pierre-Antoine Robert

Post n°299. The recent rise in inflation could affect households' and businesses' perception of inflation. This post describes new indicators of perceived inflation in France constructed from alternative data: newspaper articles and messages from the social network Twitter. The advantage of such data is that they are available at high frequency and in real time.

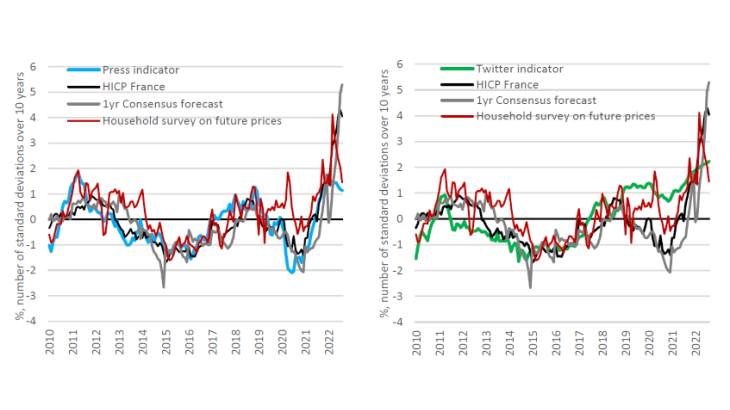
Image Chart 1. Indicators of perceived inflation based on media data (standardised and rescaled) Sources: Factiva, Twitter, European Commission, authors' calculations.
Chart 1. Indicators of perceived inflation based on media data (standardised and rescaled)
Sources: Factiva, Twitter, European Commission, authors' calculations.
Note: Indicators are standardised by their 10-year average and rescaled (divided by their standard deviation over the same period) in order to be comparable and presented on a single scale.

Central banks monitor inflation using a variety of indicators 

The price stability objective of central banks, and in particular the ECB, means that they must be able to assess not only current and future inflation developments but also the perception of inflation of economic agents. As regards current inflation, the consumer price indices published by national statistical institutes such as INSEE are closely analysed, be it for headline inflation, its components or measures excluding the most volatile items. Projections are also conducted to assess the inflationary or deflationary risks to the economy.

Maintaining price stability also requires that the inflation expectations of economic agents, households or companies, remain anchored around the inflation target set by the central bank. To measure inflation expectations, several indicators are used: i) expectations from financial markets, measured using inflation-linked bonds or inflation derivatives, ii) expectations of forecasters based on surveys (e.g. the Consensus Forecast or the Survey of Professional Forecasters), iii) expectations of companies (e.g. in France, the new survey of business leaders conducted by the Banque de France) and iv) expectations of households from surveys for example the European Commission's consumer survey or the European Central Bank's Consumer Expectations Survey (CES). The analysis in this post focuses on the way inflation is perceived through certain forms of media and the short-term expectations that can be derived from this.

Text mining of alternative data to complement traditional sources

The media disseminates a wealth of data that may reflect the inflation perceptions and expectations of households and businesses. This includes traditional media such as television, radio and print media or social networks. In the case of the press and social networks, processing this volume of data requires the use of data science techniques that analyse qualitative textual data and transform them into quantitative figures that can be used by economists in the form of indicators.

A recent work in this area, carried out at the Banque de France on French data, collects and analyses more than one million articles from the written press since 2003 (source Factiva) as well as around four million tweets since 2012 (source Twitter) to construct indicators of perceived inflation (in the spirit of the work of Angelico et al. 2022 for Italy).

The method is based on the selection of articles and tweets using keywords (related to the semantic field of "inflation" or "prices"). Filtering and classification algorithms are used to select only those that actually deal with inflation and not other subjects (e.g. literary 'prizes') and to derive the direction of inflation/prices that may be mentioned in the text (rising, falling or stable). Extensions were also explored, to exclude articles that might reflect the views of central banks themselves, and focus more on households.

Chart 2 shows the number of press articles and tweets resulting from the first stage of filtering and that can be interpreted as an indicator of attention to inflation in the media (traditional and social networks). At first sight, attention to inflation appears to increase during episodes of strong inflation or deflation - when inflation deviates from its mean value - and in particular in the recent period since mid-2021 (see rectangles in Chart 2).
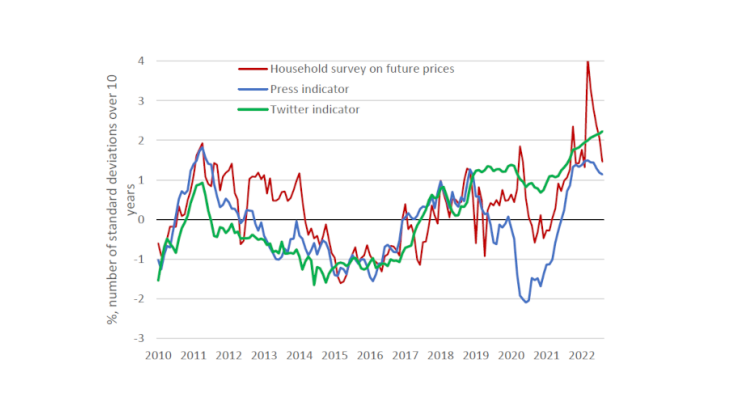
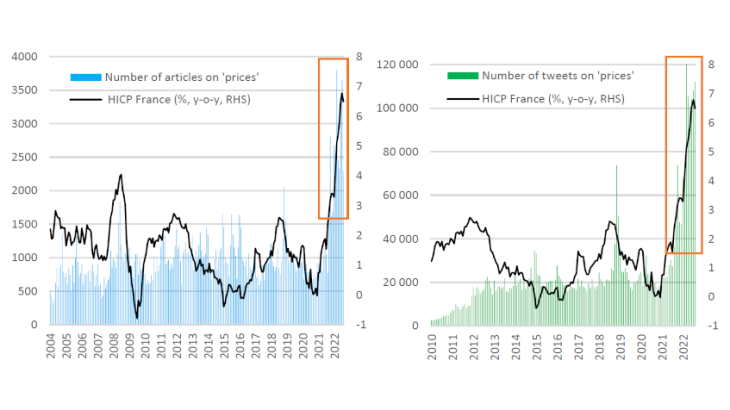
Image Chart 2. Number of press articles and tweets on prices Sources: Factiva, Twitter, INSEE, authors’ calculations.
Chart 2. Number of press articles and tweets on prices
Sources: Factiva, Twitter, INSEE, authors’ calculations.
Note: Change in the number of articles (left, over the 2004-2022 period) and tweets (right, 2010-22) on prices, and the French consumer price index (HICP, in %).

These indicators offer different information and sometimes leading inflation data

A second group of indicators, measuring the direction of price changes, are also calculated, based on the number of press articles, or tweets, mentioning a rise or fall in prices. These are "balances of opinion", along the lines of business surveys, defined as (number of increases - number of decreases, or stability)/(total number of increases and decreases, or stability). These indicators can thus capture perceptions about current or future inflation. The Press indicator yields trends that are relatively close to those of observed HICP inflation and to the expectations of professional forecasters (see Chart 3). The Twitter indicator appears to be closer to households' expectations, especially for the 2019-20 period. More specifically, the two indicators appear to offer complementary data to those of the surveys and make it possible to better capture two significant inflation episodes. On the one hand, they seem to identify the period of low inflation from 2014 to 2016 better than the surveys: they are at a low level from 2012 onwards, whereas the survey indicators remain higher. On the other hand, the turnaround in inflation in 2021 seems to appear a few months earlier with the Press indicator. The Twitter indicator is at a high level throughout the 2019-21 period, remaining closer to households' expectations, which deviate from observed inflation at this point.

Image Chart 3. Indicators derived from media data and traditional indicators Sources: Factiva, Twitter, INSEE, European Commission, Consensus Economics, authors' calculations.
Chart 3. Indicators derived from media data and traditional indicators
Sources: Factiva, Twitter, INSEE, European Commission, Consensus Economics, authors' calculations.
Note: The Press, Twitter and Household Survey indicators are constructed as opinion balances. All indicators are standardised and rescaled.

Over the 2004-22 period, the Press indicator shows a correlation of close to 0.7 with the HICP and around 0.4 with the household expectations survey. These correlations of the Press indicator are similar over the 2010-22 period of Twitter data availability. Its movements are indeed closer to the quantitative measures of inflation, observed HICP and professional forecasters' expectations (see Chart 3). Conversely, the Twitter indicator has a slightly higher correlation with the household survey, around 0.5 over the 2010-22 period, but a lower correlation with the HICP, around 0.4. It is therefore a better reflection of households' expectations - especially for the 2019-20 period - than actual inflation.

The results obtained from text mining offer many opportunities

Using attention and directional indicators from the written press or social networks, inflation can be monitored on an infra-monthly basis, with rapidly available results (within a few days). The contribution of such indicators opens up interesting avenues of research on changes in the general inflation and price environment. For example, as shown by Korenok et al (2022), they could also help detect changes in the attention paid to inflation by economic agents.