Consumer price inflation in the euro area rose sharply at the end of 2021, peaking at over 10% in October 2022 compared with October 2021, before gradually declining and settling at just over 2% in 2024. Households were particularly affected by this pronounced rise in prices as it concerned everyday purchases such as petrol in 2021 and 2022, and then food products between 2022 and 2023 (see Aldama et al., 2024, and Bignon and Gautier, 2025). In the case of food prices, international commodity prices posted a rapid and sharp rise in 2021, which was gradually passed on to producer prices and then to consumer prices (see Chart 1 and also Perrot et al., 2022). As a result, in early 2023, the year-on-year increase in food prices in the euro area peaked at close to 18% (compared with less than 2% on an annual average over the past 25 years). As international prices eased, food prices then stabilised in 2023, with their year-on-year increase remaining at 1.5% at the end of 2024.
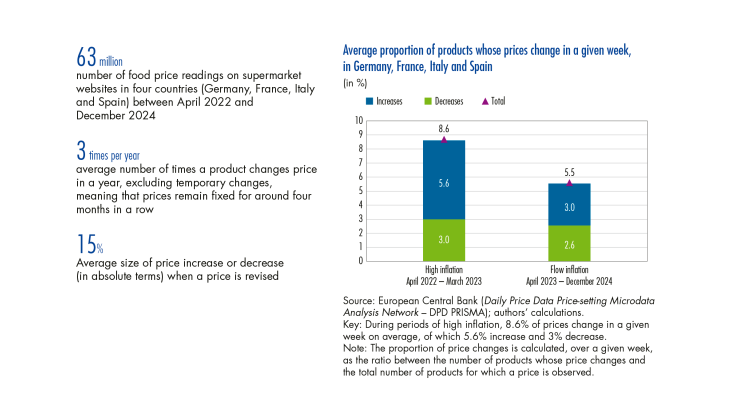
In order to monitor food price changes as closely as possible, the European Central Bank (ECB), in conjunction with the central banks of the Eurosystem, has set up a “Daily Price Dataset (DPD)” tool that collects thousands of prices every day in supermarkets in the euro area using web scraping techniques. Thanks to this tool, which was launched in April 2022, the ECB has been able to collect several million prices for close to 100,000 food products commonly sold in a number of supermarkets in the four largest economies of the euro area (Germany, France, Italy, and Spain).
Monitoring food prices in real time is useful for analysing inflation in several ways. Not only are food prices closely monitored by households, but food accounts for close to 20% of household consumption in the euro area, and changes in food prices can contribute significantly to overall inflation. In addition, food prices are largely dependent on agricultural commodity prices, which can fluctuate sharply from month to month and whose impact on consumer prices is not easy to forecast. Finally, granular daily price data provide insight into how food prices are adjusted: how many prices are changed each day, how many prices increase or decrease over a given period and, more broadly, how an economic shock is passed on to inflation. …
