- Home
- Publications et statistiques
- Publications
- The French trade balance over the past 4...
The French trade balance over the past 40 years: what are the drivers?
Post n°132. The trade balance as a share of GDP reflects decisions regarding consumption, and therefore saving, and investment. Over the past 40 years, its dynamics in France have been dominated by the cycle of construction: the balance deteriorates in boom phases. The rise in household saving, which contributed to the surplus of the 1990s, was offset after the crisis by a higher share of government consumption in GDP.

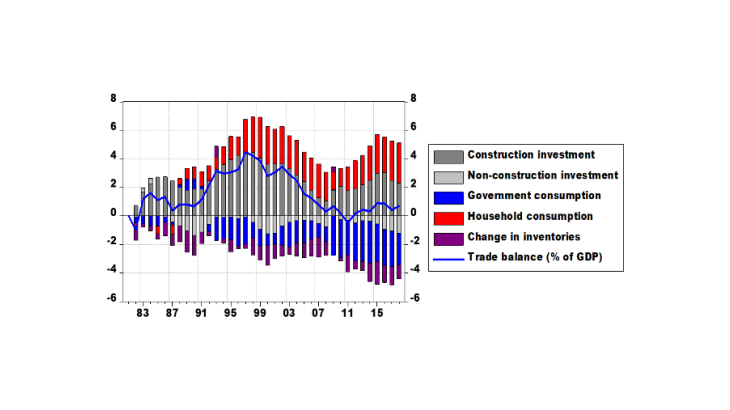
Key: the contributions correspond to the variation in the share of each GDP component with an opposite sign. For example, the trade balance improved by 4.5% of GDP between 1981 and 1997; the decline in the share of construction investment in GDP over this period contributed 4.5 percentage points to this increase.
Comments on the evolution of French foreign trade often refer to the competitiveness of the economy, its specialisation and its positioning in international markets. While these factors are key to understanding the evolution and composition of trade flows and the trade balance in level, the trade balance as a share of gross domestic product (GDP) follows a different logic: it reflects economic agents’ decisions regarding consumption – therefore saving – and investment.
Indeed, GDP is the sum of consumption, investment and the trade balance. The variation in the trade deficit as a share of GDP is therefore the sum of the change in the investment rate and the change in the consumption rate, also as a share of GDP. Thus, an increase in the investment rate, if it is not offset by a fall in the consumption rate, i.e. if domestic saving do not finance it, must be financed by saving from the rest of the world. This takes the form of a deterioration in the trade balance (leaving aside current account income).
In this post, we use this equality to highlight the drivers of the French trade balance over the past forty years. The results are presented in Chart 1. The blue line shows the change in the trade balance in % of GDP from its 1981 level. The bars show how the different components of consumption and investment contributed to this change. The chart highlights two stylised facts:
(i) Medium-term fluctuations in the trade balance mainly correspond to the investment cycle, which is largely driven by construction investment, both by households and firms.
(ii) The fall in the share of household consumption in GDP since the turn of the 1990s has contributed to raising the trade balance, but has been offset by an increase in the share of government consumption since the 2008 crisis.
It may seem surprising that price competitiveness does not play a direct role in this decomposition. The reason is that, for a given rate of investment and consumption, a rise in competitiveness certainly increases exports and the level of the trade balance, but leaves the trade balance as a share of GDP unchanged because it also raises GDP. Conversely, a decline in the rate of investment and consumption raises the trade balance as a share of GDP, but lowers imports and the level of GDP, unless competitiveness increases simultaneously.
Competitiveness gains can therefore make it possible to adjust the trade balance without weighing on growth. In addition, they can also have an indirect effect on saving and investment decisions. For example, a depreciation in the real exchange rate may lead to a temporary increase in the saving rate, and thus in the trade balance, if the additional income generated by exports is not immediately consumed.
The remainder of the post addresses in more detail the periods of increase, decrease and stabilisation of the trade balance.
Improvement in the trade balance from 1987 to 1997: higher saving and construction crisis
Between 1987 and 1997, the trade balance improved by 4% of GDP, climbing from -1 to 3% of GDP. Two dynamics were at work behind this improvement.
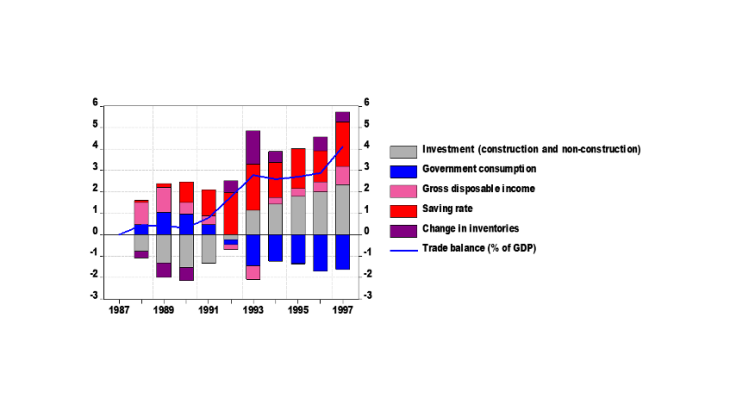
First, the rate of household consumption declined lastingly from the end of the 1980s (Chart 1, red bars). This rate depends in turn on the share of household income in GDP and on the household saving rate (Chart 2). The improvement in the trade balance was mainly driven by the rise in the saving rate at the turn of the 1990s, even if the smaller share of household income in GDP also played a role.

Second, the share of construction investment in GDP declined significantly from 1990 (Chart 1, dark gray bars). Over this period, construction investment evolved in line with the commercial real estate market at the turn of the 1990s. It increased between 1987 and 1990 during the boom. It then fell sharply in the wake of the real estate crisis, thereby contributing significantly to improving the trade balance until 1997. Non-construction investment, in particular in machinery and equipment, also peaked at the turn of the 1990s but hardly contributed to the evolution of the trade balance over the entire period.
With a lower investment rate, households’ increased saving were thus invested in the rest of the world, leading to a higher trade balance.
Fall in the trade balance from 1997 to 2008: investment boom not financed by saving
In 1997, the trade balance experienced a reversal followed by a long decline until the 2008 crisis, slipping from 3 to around -1% of GDP. This deterioration resulted from a construction investment boom not financed by increased saving from households or government.
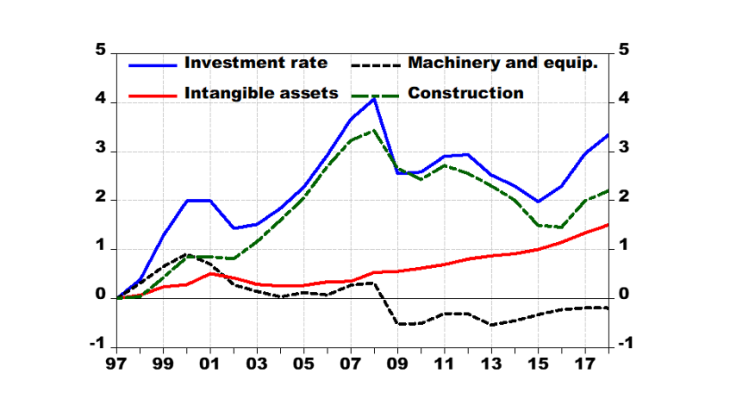
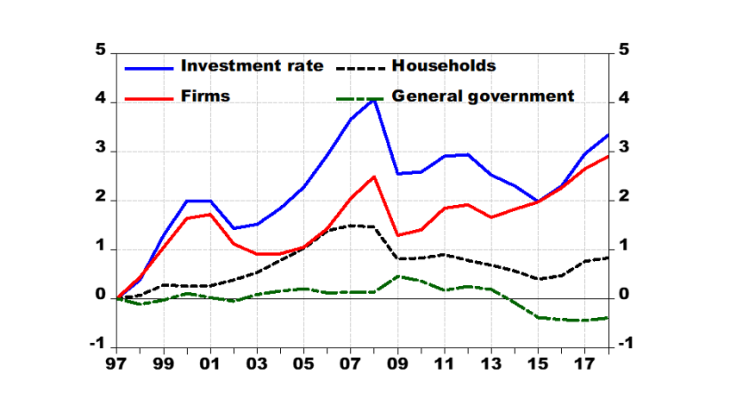
The share of construction investment increased by more than 3% of GDP over this period. This is by far the largest contribution to the evolution of the trade balance (Chart 1, dark gray bars). Indeed, the shares of government consumption (blue bars) and private consumption (red bars) remained relatively stable over the period. Without a rise in domestic saving, this additional investment must therefore be financed by the rest of the world, leading to an increased trade deficit. The rise in the investment rate concerns almost exclusively construction investment (Chart 3) and is due to both households and firms (Chart 4).
A steady trade balance since 2008: government consumption takes over from investment
Construction investment has fallen sharply since the 2008 crisis, which should have led to an improvement in the trade balance (Chart 1, dark gray bars). This decline was, however, largely offset by an increase in the share of government consumption in GDP (blue bars). The strong growth of non-construction investment, after the shock of 2008−2009, also contributed to the deterioration in the trade balance (light gray bars). As shown in Chart 3, this is notably the case for investment in intangible assets, which has risen sharply over the past ten years. This enabled the corporate investment rate to rebound after the crisis, exceeding its 2008 peak in 2017. However, the investment rate in machinery and equipment remained constant over the period.
These results show the important role played by the construction investment cycle in trade balance dynamics. More recently, the sharp rise in investment in intangible assets has also weighed on the trade balance. This development is not necessarily a negative one. The question is whether this type of investment will improve the competitiveness of French firms, eventually resulting in rebalancing of the French trade balance without weighing on growth.
Updated on the 25th of July 2024

