Eco Notepad

What are the financial risks to euro area growth?

Published on 27 May 2019
Authors : Laurent Ferrara, Matteo Mogliani, Jean-Guillaume Sahuc, Naomi Cohen

Post n°116. Monetary policy decisions require a prior assessment of different economic scenarios, including the most extreme ones. Assessed on the basis of the Banque de France's Financial Conditions Index, financial risks that are likely to weigh on the distribution of future euro-area GDP growth appear limited.

Image Chart 1: Expected distribution of euro area quarterly GDP growth between 2001 and 2018 Sources: Eurostat, Banque de France, authors' calculations.
Chart 1: Expected distribution of euro area quarterly GDP growth between 2001 and 2018 Sources: Eurostat, Banque de France, authors' calculations.

Note: This chart represents for each quarter the distribution of the projections of the quarterly GDP growth rate for the following quarter, obtained from the Growth-at-Risk approach.

Financial market dynamics play a major role in the macroeconomic cycle. Monitoring the changes in financial conditions thus provides economic decision-makers with valuable information on the contribution of financial risks to future economic growth, which enables them to react preventively. Adrian et al. (2019) developed a tool for measuring financial risks to US economic growth, using a measure known as the Growth-at-Risk (GaR) approach, equivalent to the Value-at-Risk concept in finance. This measure is used to monitor the distortion of the entire expected growth distribution according to financial market developments (see Chart 1). This approach is now widely used by the International Monetary Fund in its biannual assessment of the global financial system. In this post, we apply this approach to the euro area by measuring financial conditions using the index developed at the Banque de France by Petronevich and Sahuc (2019).

Image Chart 2: Elasticity of the GDP growth rate to the financial conditions index for different quantiles Sources: Eurostat, Banque de France, authors' calculations.
Chart 2: Elasticity of the GDP growth rate to the financial conditions index for different quantiles Sources: Eurostat, Banque de France, authors' calculations.

Note: This chart shows the results of the regression of the GDP growth rate on financial conditions for each quantile of the distribution of GDP variations. The slope of the regression is 0.04 for the 95% quantile and -0.2 for the 5% quantile.

Link between financial conditions and euro area growth

The theoretical and empirical literature has shown that financial markets play a key role in the transmission and propagation of shocks, but that the relationship between financial market developments and economic growth is complex and non-linear. In particular, Bernanke and Gertler (1989) formalised the amplification mechanism of financial shocks to the real economy. In this context, we use the quantile regression method over the period 2001-2018 to assess the sensitivity of future euro area GDP growth to our financial conditions index. This regression is useful because it delivers an estimate of the elasticity of the GDP growth rate to financial conditions for any range of values (referred to as quantiles) of the economic growth rate, and thus captures the non-linear nature of this relationship. Chart 2 shows the values of these elasticities for various quantiles, when macroeconomic conditions in the previous quarter are controlled for, and the elasticity (quantile independent) estimated by standard linear regression. The latter is negative, which indicates that a tightening of financial conditions tends on average to slow economic activity. However, the quantile regression indicates that the relationship is the strongest (around -0.20) for changes in GDP located at the bottom of the distribution (which are most often negative), thus highlighting a significant non-linear effect. A tightening of financial conditions tends to amplify the effects of negative shocks to the real economy, while an easing of these conditions has a more limited impact on economic activity.

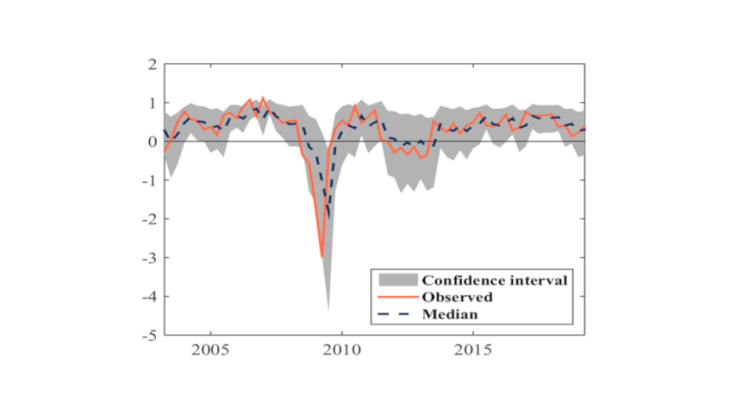
The forecasts obtained from the model are close to the GDP growth rates observed in the euro area (see Chart 3). The confidence interval, measured as the difference between the highest and lowest of the conditional quantiles, is asymmetric, especially during periods of recession. During these episodes, we observe that the distance between the 5% quantile and the median is greater than that between the 95% quantile and the median. This shows that the model is able to correctly take into account financial risks. While the upside risks are relatively stable over time, the downside risks vary greatly depending on the financial conditions of the euro area.
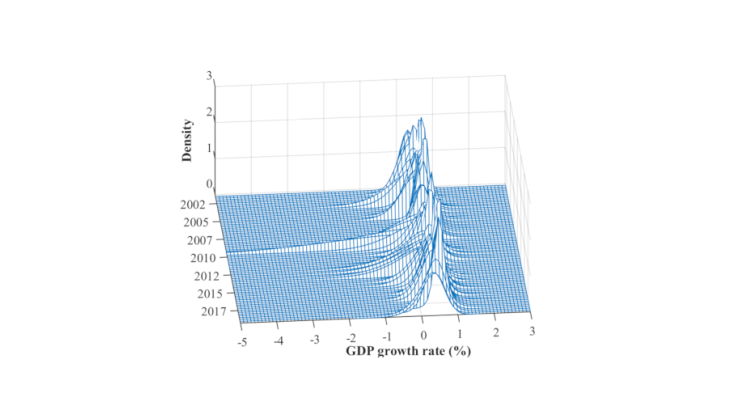
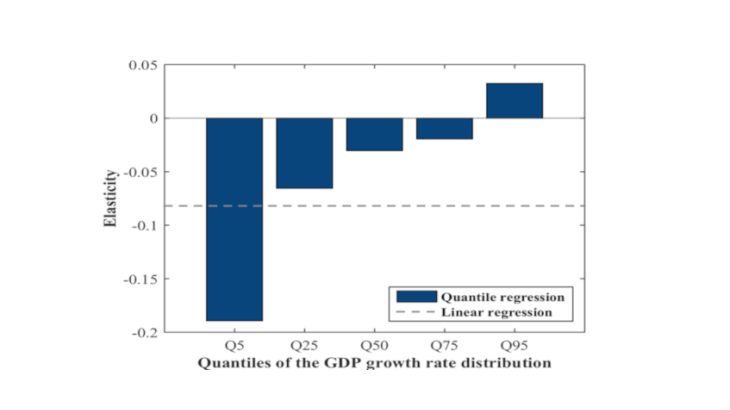
Image Chart 3: Observed quarterly GDP growth (%), Sources: Eurostat, Banque de France, authors' calculations.
Chart 3: Observed quarterly GDP growth (%), Sources: Eurostat, Banque de France, authors' calculations.

Measure of financial risk in the euro area

In order to measure financial risks in the euro area, a probability must be assigned to the different possible economic growth patterns. The GaR approach uses an asymmetric and fat-tailed probability distribution, which enables us to take into account the occurrence of rare events and to draw the curve that links the estimated values at the different quantiles. The measure of the downside risk, which we refer to as GaR5%, is then depicted by the 5% quantile because the latter commonly represents an alert threshold of critical changes in a phenomenon.

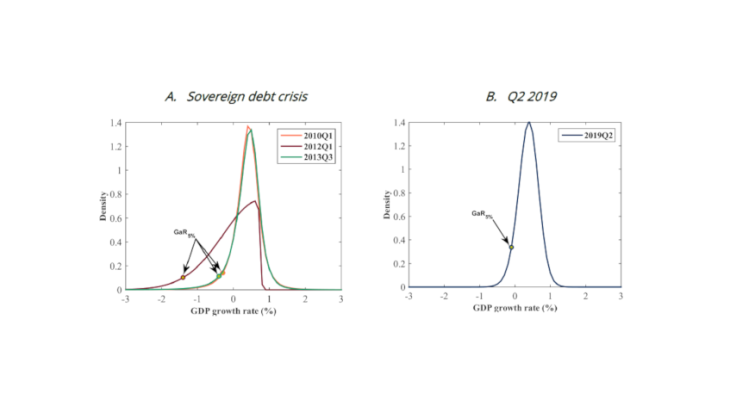
In order to illustrate how the distribution of future GDP growth is distorted over time, we take the example of the sovereign debt crisis that affected the euro area from 2010 to 2013 and caused a recession from the third quarter of 2011 to the first quarter of 2013, according to the CEPR’s dating. Panel A in Chart 4 shows that the measure stood at around -0.5% at the beginning of the crisis (orange curve), which means that the probability of the quarterly change in euro area GDP dropping below -0,5% was 5% in 2010. The measure GaR5% then dropped to -1.5% in 2012 (red curve), at the time when the downgrading of sovereign ratings by rating agencies pushed bond rates up to critical levels for peripheral European countries. At end-2013, the measure returned to its pre-crisis level (green curve). This example highlights the ability of our measure to monitor the risks to economic growth related to financial conditions in the euro area.

Image Chart 4: Growth-at-Risk indicator for the euro area at different periods Sources: Eurostat, Banque de France, authors' calculations.
Chart 4: Growth-at-Risk indicator for the euro area at different periods Sources: Eurostat, Banque de France, authors' calculations.

According to the assessment based on the Growth-at-Risk indicator, the level of downside risks to growth is relatively low in 2019. Indeed, our measure GaR5% is close to 0% for Q2 2019, consolidated by the easing of financial conditions in Q1 2019 (see Panel B in Chart 4). However, financial conditions could deteriorate in the wake of the recent Sino-US trade tensions.