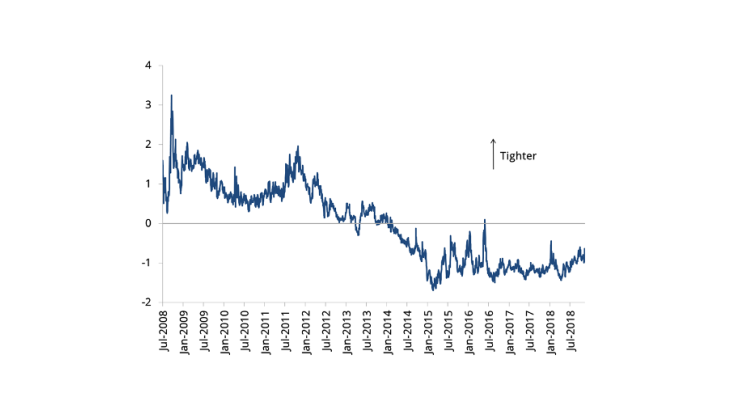
Financial conditions are important because they influence current and future economic activity in ways that are not fully captured by the short-term interest rate, especially in presence of an effective lower bound. By monitoring their development, central banks can assess whether their accommodative policies result in financial conditions that are stimulating enough to help economic growth, while investors can use them to design their investment strategies. The 2008 global financial crisis has led to a proliferation of indices that proxy for financial conditions or financial stress (e.g. Goldman Sachs FCI, Morgan Stanley FCI, Bloomberg FCI and others), but there is still no consensus about the correct way to estimate FCIs. We propose a new FCI for the euro area which uses principal component analysis and relies on time-varying weights. There are three key advantages of this framework relative to other methodologies: (i) it is based on a broad dataset, (ii) it is transparent and (iii) it can be decomposed into main drivers. Furthermore, it can adjust to the rapidly changing environment of the financial sector through the time-varying weights attributed to each driver.
How does it differ from other FCIs?
Data selection. An FCI should cover a wide spectrum of data in order to keep track of various sources of complications in the financial sector. Our FCI is based on 18 daily series on sovereign and market rates, corporate spreads, stock exchange indices, inflation-linked swaps at different maturities, surprise and volatility indices. The use of 18 financial series makes our indicator one of the broadest indices among established FCIs.
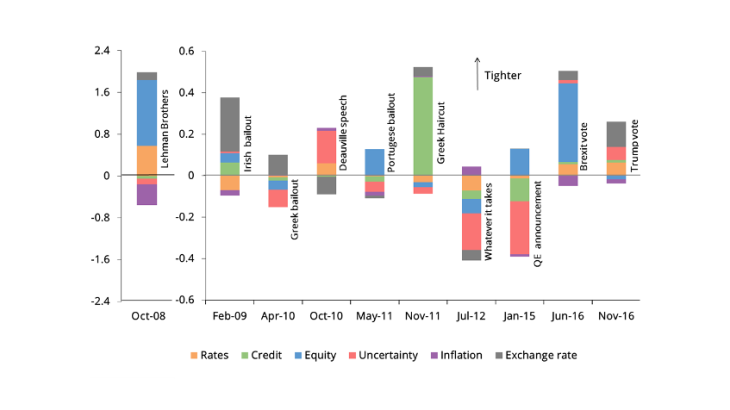
Traceability and tractability. In contrast with many other indices, our FCI is calculated using a clear and tractable methodology, which makes the indicator transparent and replicable . Furthermore, this allows us to decompose the dynamics of the FCI into six main drivers: rates, credit, equity, uncertainty, inflation and exchange rates.
Aggregate index with time-varying weights. In finance, the volatility of a series is as important as its level. Indeed, changes in volatility impede forecasting and delay investment decisions. Our FCI uses the information contained in both current levels of series and their volatility, so that increased instability of a component gives the latter a greater weight in the FCI.
How is it constructed?
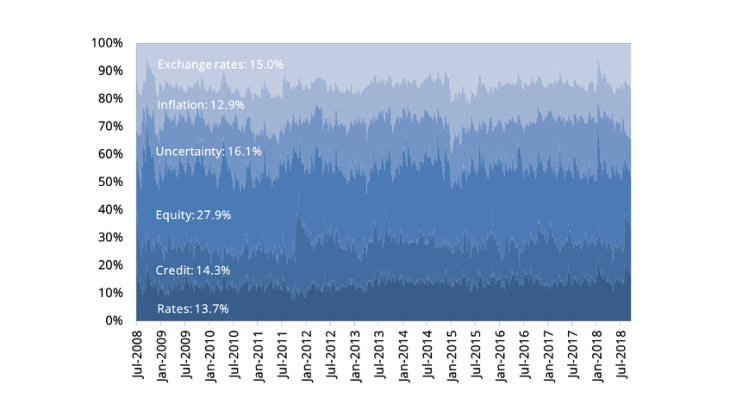
The construction of our FCI is performed in two steps. In the first step, the 18 initial financial series are combined into six main factors with the help of the principal component analysis, which captures strong patterns in a dataset while minimising the information loss due to aggregation. The series have been reconciled so that an increase in all series indicates a tightening of the financial conditions. Following the common practice of FCI construction, we assume that an appreciation of the euro exchange rate leads to a tightening of financial conditions as it lowers inflation (through imports) and increases the real interest rate. In the second step, we compute the conditional volatilities for each of the factors using a statistical model commonly employed when series exhibit time-varying volatility (a generalised autoregressive conditional heteroskedasticity model). The indicator is then calculated as a weighted average of the factors, where the weights are the corresponding conditional volatilities normalised so that they sum up to one in each period (Chart 2).


