Eco Notepad

Firms' net borrowing improved slightly over the last 10 years

Published on 18 September 2018
Authors : Hadrien Camatte, Jean-François Ouvrard

Post n°85. According to the May 2018 revised national accounts, the net borrowing of non-financial corporations improved slightly over the previous 10 years to 0.4 pp of GDP in 2017. This mainly reflects the sharp reduction in net financial expenses, while the share of compensation of employees and gross investment in value added increased.

Image More favourable results for the net borrowing of NFCs using a 2014 base (% of GDP)
Chart 1: More favourable results for the net borrowing of NFCs using a 2014 base (% of GDP)
Source: Insee national accounts.

The switch to a 2014 base in the national accounts in May 2018 led to significant revisions in the non-financial corporations' (NFCs) account. In particular, the net borrowing of NFCs now appears considerably less impaired as the shortfall stood at EUR 10.2 billion in 2017 (‑0.4% of GDP) compared with a shortfall using the 2010 base of EUR 44.9 billion, or -2.0% of GDP, in 2016, which was the last year the 2010 base was used.

In addition, while the net borrowing of NFCs appeared largely stable between 2006 and 2016 using the 2010 base (between -1.8% and -2.0% of GDP), it now shows a 0.5 percentage point improvement between 2006 and 2017.

We will not address the statistical and methodological reasons behind the rebasing of the national accounts as they have been well documented by Insee (see, in particular, The national accounts switch to 2014 base and Estimates of income property flows in the 2014 base). Rather we will examine the path of the net borrowing of NFCs since 2006 (chosen for its "average" characteristics compared with 2007, which experienced peaks in the margin rate and investment rate in particular) and we will focus on NFCs alone, and not on NFCs-IEs, for which a complete account, down to net lending or net borrowing, is unavailable.

Since 2006, compensation of employees and investment have risen and financial expenses have declined

Generally speaking, the non-financial corporations' account is set out from gross value added (VA) down to net lending or net borrowing via the following steps: (i) value added finances compensation of employees and taxes on products net of subsidies (including the CICE competitiveness and employment tax credit), resulting in gross operating surplus (GOS); (ii) net financial expenses (interest and dividends paid and received) and taxes on income (mainly corporation tax) are paid out of GOS, giving gross saving; (iii) gross fixed capital formation (GFCF), inventories and other asset acquisitions are then financed out of gross saving to arrive at net lending or net borrowing (see diagram). Certain items, such as current and capital transfers and imputed contributions, are omitted from this simplified diagram as they play a relatively marginal role.

Image Simplified diagram of the NFCs' account
Simplified diagram of the NFCs' account

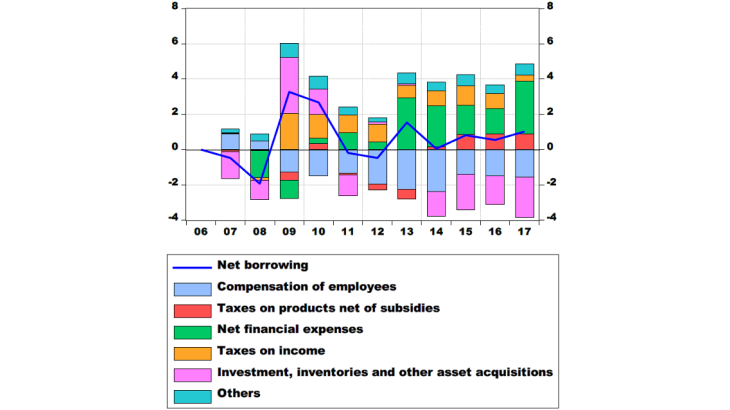
Chart 2 shows the contributions of these different items to the change in the net borrowing of NFCs, in points of NFC value added compared with 2006. Some general trends are clearly visible.

Image Cumulative contribution to changes in the net borrowing of NFCs since 2006 (in percentage points of VA)
Chart 2: Cumulative contribution to changes in the net borrowing of NFCs since 2006 (in percentage points of VA)
Sources: Insee national accounts, 2014 base; authors' calculations.

Taxes on income played their normal buffer role, with a share in value added that declined considerably from 2009 but in 2017 returned to a level close to that seen in 2006.

The first factor in the deterioration of the net borrowing of NFCs is the increase in the share of compensation of employees in value added since 2006, with an increase seen mainly in 2009 (see Cette and Ouvrard, 2018). This has been partially moderated by the CICE tax credit, visible since 2015 in the reduction in the share of taxes on products net of subsidies.

The second factor weighing on their net borrowing between 2006 and 2017 is capital formation (gross investment and inventories), whose share in value added first dropped sharply in 2009-10 before increasing to a level far in excess of that of 2006 and even that of the previous peak seen in 2007. The national accounts with a 2014 base also confirm (using data only currently available up to 2014) that the increase in the share of gross investment in value added (both gross and net) results from the greater share of fixed capital consumption, while the share of net investment declined (see Sicsic, 2018).

Conversely, the sharp reduction in net financial expenses made a positive contribution to the changes in the net borrowing of NFCs and more than offset the negative impact of the increase in the share of compensation of employees and investment.

A significant drop in the share of net interest and dividends since 2006

Flows related to financial charges have a substantial impact on the NFCs' account with EUR 257 billion in expenses (22% of value added) and EUR 224 billion in receipts (19% of value added) in 2017. However, given the accounting difficulties encountered in terms of consolidation at the NFC level in particular, examining the aggregate flows, i.e. receipts net of expenses, is recommended (see Cnis' cost of capital report, 2015).

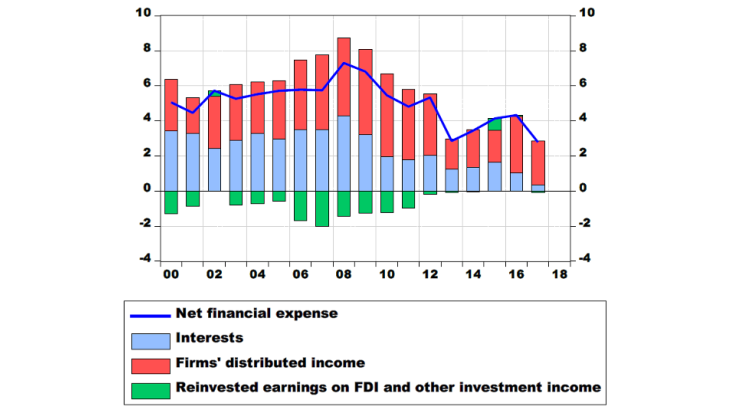
Thus, Chart 3 presents (in percent of value added) the net financial expense of NFCs and their main components: net interest and net distributed income (dividends), for which NFCs are net payers; and reinvested earnings on foreign direct investment (FDI), for which they are net creditors.
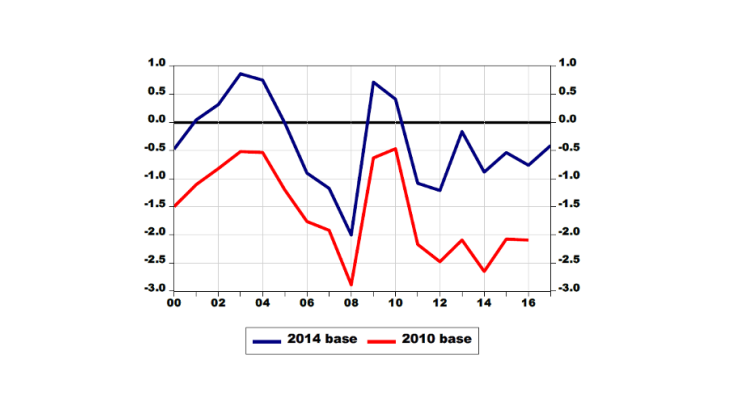
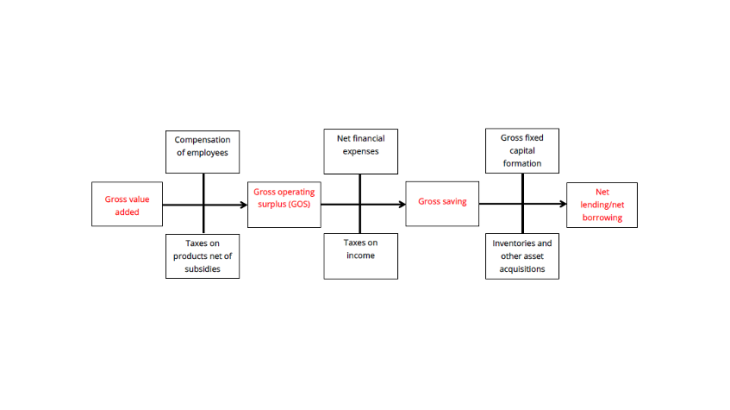
Image Reduction in all NFC net financial expense items (in percentage points of VA)
Chart 3: Reduction in all NFC net financial expense items (in percentage points of VA)
Sources: Insee national accounts, 2014 base; authors' calculations.

The net financial expense of NFCs corresponded to only 2.8% of NFC value added, or EUR 33 billion, in 2017. This is well below the levels observed in 2006 (5.8% of VA, or EUR 54 billion), and more generally during the 2000s. The sharp reduction in the net financial expense stems from the decline in the shares of both net distributed income (down 1.5 percentage point of VA) and net interest (down 3.1 percentage points of VA). Conversely, net income from reinvested earnings on FDI also fell significantly (an increase of 1.6 point of VA in the net financial expense).

All available indicators suggest that the decrease in the share of net financial expense in value added does not stem from a sharp acceleration in value added (a denominator effect), but from an overall decline in financial returns since 2008.

Updated on 9 April 2024