Eco Notepad

A lower net investment rate than at the end of the 1990s

Published on 7 May 2018
Authors : Pierre Sicsic

Post n°64. In France, the gross investment rate of non-financial corporations is trending upwards, and was half a percentage point higher in 2016 than its previous peak of 2007-2008. However, after deducting capital depreciation, the net investment rate, which corresponds to the increase in productive capital, was one percentage point lower than its 2008 peak and equivalent to its mid-2000s level. The acceleration in depreciation stems from the increase in both capital per unit produced and in the average depreciation rate, which is itself linked to the greater share of intangible assets in investment.
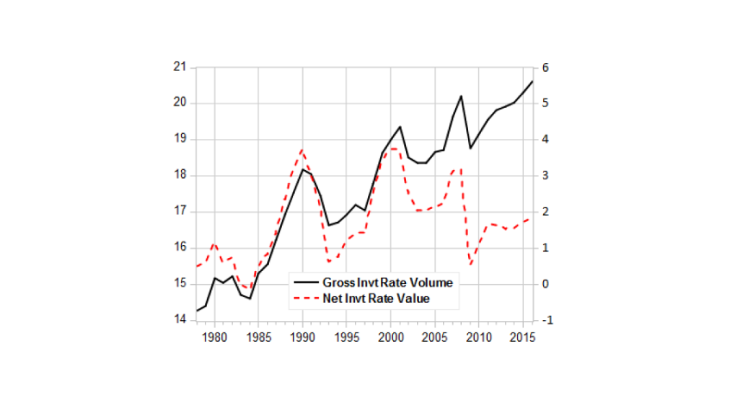
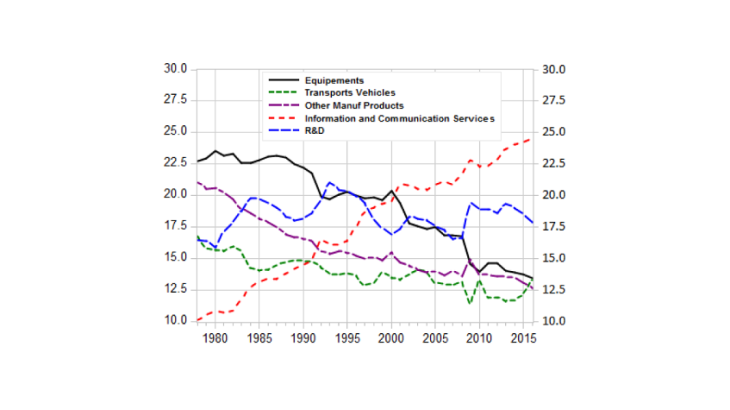
Image In France, the gross investment rate of non-financial corporations is trending upwards, and was half a percentage point higher in 2016 than its previous peak of 2007-2008. However, after deducting capital depreciation, the net investment rate, which corresponds to the increase in productive capital, was one percentage point lower than its 2008 peak and equivalent to its mid-2000s level. The acceleration in depreciation stems from the increase in both capital per unit produced and in the average depreciation
Chart 1: Real gross and net investment rate in France (NFCs-IEs approximation)
Sources: National Accounts tables 6.302 and 6.462.
The nominal investment rate of NFCs was 23.3% in 2008 and 2016, table 7.101.

The gross investment rate is shown on the left and net on the right, including construction. The denominator is real gross value added in both cases. Sectoral calculation to approximate the NFCs-IEs: Total less financial and insurance activities, real estate activities, and mainly non-market services. The real value added is not available in the NFC account, hence the sectoral approximation.

Investment increasingly centred on high-depreciation products

According to national accounting principles, investment or gross fixed capital formation (GFCF) does not only include capital goods but also databases and software, as well as R&D expenditure. Two decompositions are available for investment. One, broken down into around 40 products, and the other, less detailed, into a dozen classes of assets. Consumption of fixed capital (CFC) is only published as a decomposition by asset type.

The share of machine equipment was at its highest in 1980 (Chart 1): 24% of investment excluding construction. It steadily declined to stand at just 14% en 2016, whereas the share of transport equipment was stable at around 14%. Generally speaking, investment in services offsets the decrease in the share of industrial goods. The share of information and communication services (including software) rose the most, i.e. from 10% in 1980 to 24% in 2016.

Image Breakdown by goods of real investment (excluding construction)
Chart 2: Breakdown by goods of real investment (excluding construction)
Source: Insee: “Gross fixed capital formation” for all sectors (table 5.301).

Note: The "other services" item is not represented; it has increased from 12% of investment excluding construction in 1980 to 18% since 2007. Construction accounted for between 44% and 48% of total investment from 1990 to 2016, and more before 1990. "Computer, electronic and optical products" accounted for 20% of investment in "equipment" in 1980 and 32% in 2016.

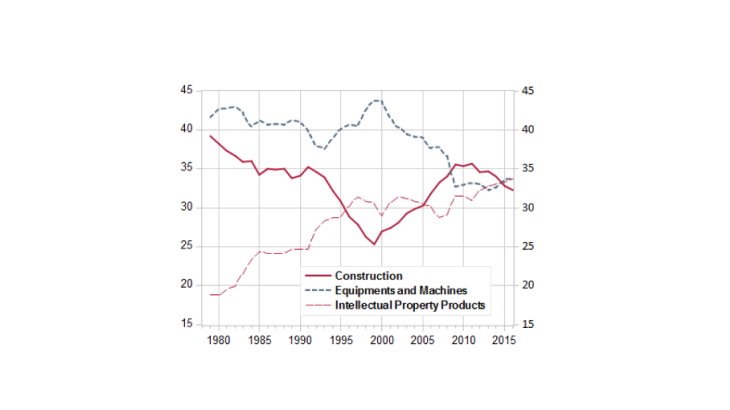
Without taking account of cyclical fluctuations, the asset class breakdown of NFCs' GFCF shows that the share of construction assets (dwellings and other buildings and structures) was stable, with a decreasing share of machinery and equipment, and an increasing share, from 20% to 34%, of assets covered by intellectual property rights (R&D, software and databases, entertainment, literary or artistic originals, see Chart 3). The latter asset class depreciates faster than capital goods.

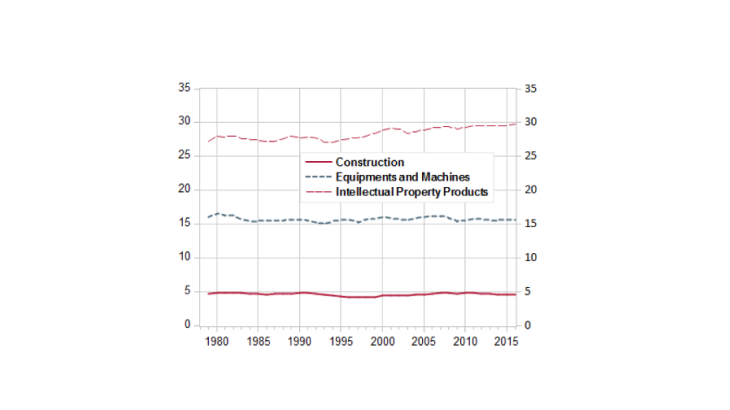
As regards "machinery and equipment”, the depreciation rate was stable over time at between 15% and 16%. As regards "intellectual property rights", the depreciation rate was much higher, and rose slightly, from 28% up to the end of the 1990s to almost 30% in 2016 (Chart 4). These depreciation rates were higher than the corresponding ones in US national accounts, hence the lower level of Consumption of Fixed Capital in the United States than in France.

Image Breakdown by asset of NFC investment
Chart 3: Breakdown by asset of NFC investment
Source : Insee

The increase in NFCs' consumption of fixed capital in France, from 17% to 20% of gross value added between 1999 and 2016, stemmed from the rise in the capital coefficient (capital to nominal value added ratio, which rose from 1.8 to 2.0) and the acceleration in the aggregate depreciation rate from 9.3% to 10%. This acceleration in the aggregate depreciation rate can above all be attributed to a composition effect (increase in the share of assets with the highest depreciation rates) rather than an increase in the depreciation rates of each asset class.

Image Depreciation rate by asset class
Chart 4: Depreciation rate by asset class
Source: Insee "Balance sheet and changes in the wealth of non-financial corporations" table 8.212.
Ratio of consumption of fixed capital to net capital at the end of the previous year.

The relative price of investment goods did not decline

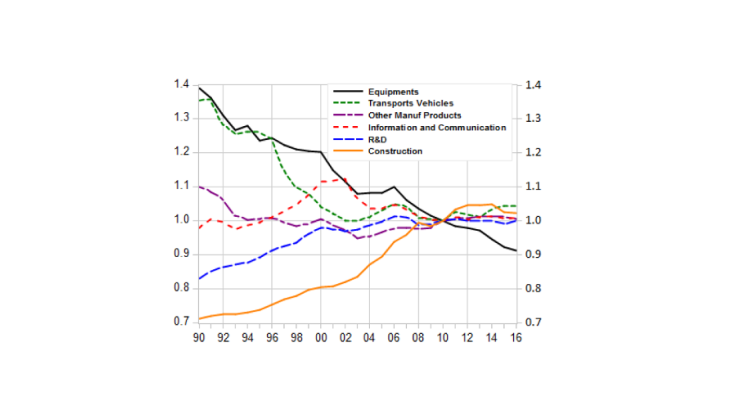
Faster deterioration of an asset whose price is decreasing makes depreciation less costly. The decline in the relative price of capital goods is shown in Chart 5. For transport equipment, the relative decrease was interrupted, and for the other investment categories there have never been any declines. Lastly, in France, since the middle of the 1990s, the total relative price of NFCs' GFCF has been stable, and thus the real and nominal investment rates are identical.

Image Chart 5: Relative deflators of the different investment categories (by products)
Chart 5: Relative deflators of the different investment categories (by products)
Sources: Insee: "Gross fixed capital formation" for all sectors (tables 5.301 and 5.302).

The increase in CFC is common to all large European countries. Compared with our neighbours, and for the economy as a whole (i.e. for data availability reasons, including household, government and corporate investment), the net investment rate in France was above that of Germany, Spain and Italy in 2016. This was also the case for the gross investment rate.

Euro area investment rate, whole economy

Source: Eurostat (naida_10_gdp) GFCF to GDP ratio and GFCF less CFC to GDP ratio.

  Gross rate in 2003 Gross rate in 2016 Net rate in 2003 Net rate in 2016
Germany 19.5 20.0 2.5 2.5
France 20.9 22.0 5.2 4.0
Italy 20.7 17.1 5.6 -0.0
Spain 27.7 20.0 13.6 2.6


The observation of net rates should be interpreted with caution since there are major uncertainties surrounding the measurement of CFC, which means that national accountants in all countries continue to favour gross aggregates (see the blog article on the net margin rate).