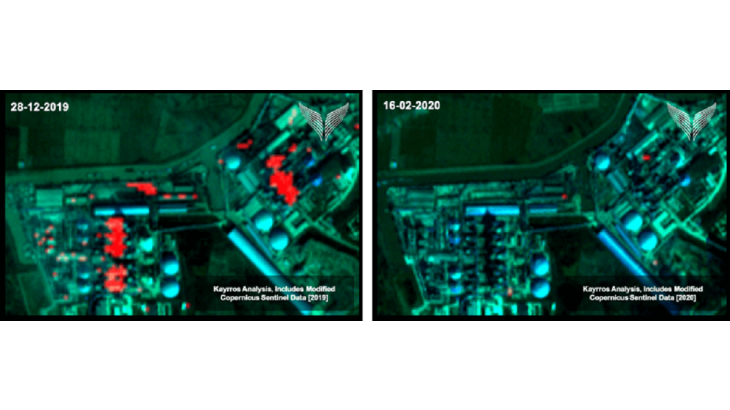
Post n°326. To monitor the global economy in real time, the detection by satellite of the heat emitted by cement plants in operation can be used to construct a production indicator. This indicator, used in a neural network model to predict construction activity, performs very well compared with benchmark models and other indicators.

Source: Sentinel-2, authors using Kayrros data
Note: Pixels flagged in red are those for which the algorithm detects heat from cement kilns.
Cement, an ideal candidate for tracking economic activity
Cement forms the basis of much of the infrastructure built by man, making it the second most widely used material in the world after water. The exact location of all the cement plants, available on the cemnet.com site, makes it possible to locate their kilns (ovens) and identify them for satellite tracking. Furthermore, cement has many characteristics that make it a good economic indicator.
First, during production, this raw material is heated in a kiln to around 1,500°C. This heat can then be detected by the satellites' infrared sensors.
Second, the high energy costs involved in operating a kiln mean that an active kiln must run at full capacity in order to maximise the return on its operating costs. In other words, it is reasonable to assume that if a kiln is identified as active, it is operating at its maximum capacity : the latter are public data , which makes it possible to estimate the volume of production based on the number of active kilns. Moreover, in general, the bulk of production is consumed locally (in France, imports account only for 15% of production and come mainly from Belgium and Spain (INSEE)), thus linking production and consumption at local level.
Lastly, as cement is an unstable substance highly sensitive to humidity, it is generally consumed shortly after production. All of these characteristics make it possible to develop an indicator that is a priori strongly correlated with activity in the construction sector.
Satellites: global, uniform, real-time data for economists
Our recent article (d'Aspremont et al., 2023) uses satellite data available in real time and free of charge, with a global coverage and uniform quality. The combination of these advantages contrasts with official industrial production data, which is usually published by the national statistical institutes with variable lag times, and whose quality, comparability and reliability can also vary from country to country.
While the literature attempting to exploit satellite data has so far focused on night lights (Donaldson and Storeygard, 2016) and more recently on air pollution (Bricongne et al., 2021), we make use of a data source that has yet to be exploited in economics: infrared data.
This is possible thanks to the Sentinel-2 satellites launched by the European Space Agency in 2017. By analysing the intensity of emissions in the different bands of the infrared spectrum picked up by these satellites, our algorithm can determine whether an object on the ground is hot and located in a cement plant.
On satellite images, clouds can interfere with infrared emission measurements. Using a neural network that recognises clouds in images, it is possible to identify cloud cover automatically. If this cover is too extensive, the observations are excluded in order to ensure the quality of our indicator.
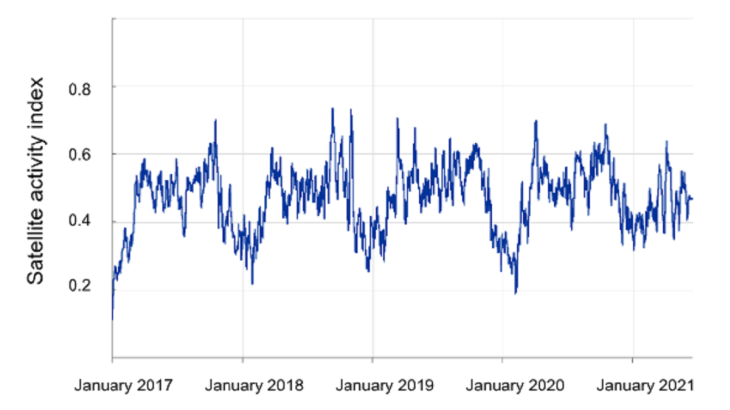
Lastly, we interpolate the missing data (because the satellite revisit period is around 4 days) using a gradient boosting machine learning algorithm. In fine, this produces a daily index of cement plant activity available in near-real time for the 38 countries in our sample with official monthly statistics (25 advanced and 13 emerging countries); and covered by our satellite data, similar to the example in Chart 2.

Satellite activity index
Source: authors’ calculations using Kayrros data
Note: The index represents a country's capacity utilisation rate, equal to the average utilisation rate of each cement plant (e.g. 0.2 if 1 kiln out of 5 is active), weighted by its capacity.
An innovative indicator that outperforms benchmark models
We then test the ability of our index to forecast cement production and construction activity. Cement is a key constituent of concrete, the material the most widely used in construction worldwide according to Infociments, making cement production and construction highly correlated. The performance of this indicator outperforms benchmark models.
First, we aggregate our daily index at monthly level to match the frequency of official data and use a linear model between this index and official statistics on cement production or construction activity (obtained from national statistical institutes). This model, based on our satellite index, gives more accurate forecasts than the usual basic models (random walk and autoregressive model) as well as the benchmark linear models based on the usual construction indicators (building permits, Purchasing Managers' Index (PMI) and Google Trends). On average, the linear model using satellite data improves accuracy (measured by the mean squared error of out-of-sample forecasts) by around 30% compared with a random walk, 10% compared with an autoregressive model, and 7-10% compared with models using the other usual indicators.
Lastly, we explore a type of non-linear regression using neural networks. They outperform the linear model by around 10% on average - and by close to 40% for some countries (e.g. Russia). Chart 3 shows that neural network forecasts are very close to production statistics for both China and the United States, with accuracy gains of 10% and 12% respectively compared with the OLS model. This is another contribution of our study: neural networks can be useful for nowcasting (forecasts about the present or the recent past, giving advance signals compared with official figures) in macroeconomics. This confirms recent applications of nowcasting with neural networks to GDP (Woloszko, 2020) and trade (Hopp, 2021).
Furthermore, because our indicator uses high-precision data measured in near-real time, it enables us to detect any disruption to the economy at an early stage. The third part of Chart 3 shows, in percentage terms, the difference in activity between cement plants in Hubei province and those in the rest of China: the effect of Covid-19 can be seen immediately.
Cement production (thousands of tonnes) United States, China, Actual production (USGS), Estimate, Difference in cement activity (%); Hubei province (Wuhan) vs rest of China, First quarter Covid
Sources: Sentinel-2, authors’ calculations using Kayrros data, USGS and National Bureau of Statistics of China
Notes: Hubei is the Chinese province where Covid-19 pandemics started. Estimated production of the United States and China (over 50% of world production: see Cembureau). Raw level data (adjusted for seasonal and working-day variations in the article).
These results open up a wide range of avenues. First, they show that official statistics can be reproduced more quickly - and possibly at high frequency, which can be useful in times like the Covid-19 period. Second, what has been achieved with cement can be extended to other heat-emitting activities such as steel and glass. Emerging and developing countries are covered in the same way as developed countries, enabling monitoring where official statistics are lacking. Lastly, activity can be studied at sub-national level, as for the United States in our article, if the number of factories is sufficient.
Download the PDF version of the publication
Updated on the 25th of July 2024