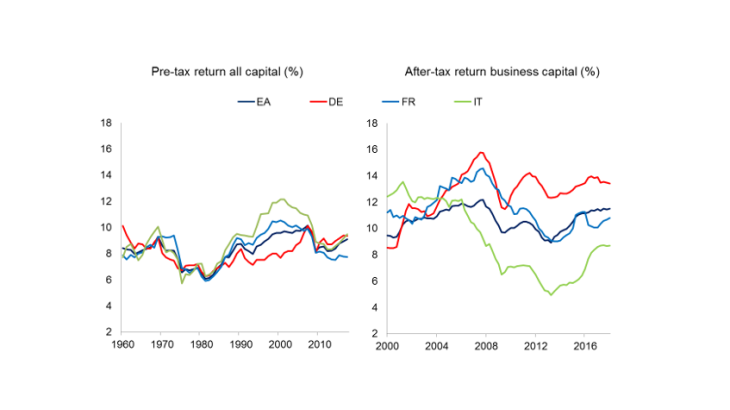
Our second approach takes a narrower perspective and calculates the after-tax real return on business capital, which is based on non-financial corporate sector earnings. It is arguably the most relevant measure from a macroeconomic perspective, as it is more directly linked to firms’ investment decisions (Chart 2, RHS). While some caution is warranted when directly comparing the levels of the return on capital using different approaches, both approaches exhibit a similar evolution: for several decades the return on capital has remained broadly stable in the euro area with Italy experiencing somewhat more volatility. Although not shown here, this also holds for the United States.
Presently, there is some debate that the stock of intangible assets may be underestimated in the National Accounts, and that this could lead to overestimating the return on capital. A back of the envelope exercise assuming a 50% underestimation indicates that the impact on the return on capital would remain limited, namely less than 1 percentage point, which echoes the findings of Fahri and Gourio, 2018.
A growing wedge between the return on capital and the risk-free rate…
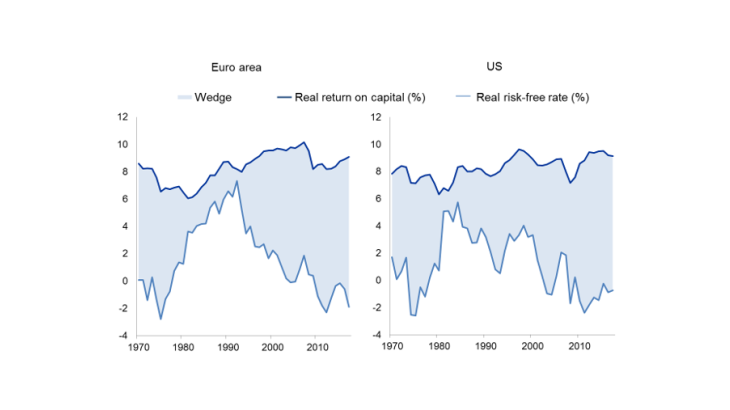
The relative stability of the return on capital contrasts with the secular decline of the return on safe assets, which has led to a wedge emerging between the two asset classes that is currently at its widest level (Chart 1). To date, there is only a small number of studies which have examined the factors behind this wedge (Caballero, Farhi and Gourinchas, 2017; and Marx, Mojon and Velde, 2018).
…driven by growing risk premia and marks-up
In order to get a better handle on what is behind this wedge in the euro area, we employ the accounting framework proposed by Caballero, Farhi and Gourinchas, 2017 which links the evolution of the wedge to developments in four key economic variables: the labour share, risk premia, expected capital loss and mark-ups. In the current exercise we adopt a Cobb Douglas production function instead of a CES production function, which implies that changes in the labour share are accounted for by changes in mark-ups and that capital augmenting technology does not play a role. While not reported, we have also used a CES production function and the main results outlined below still hold.
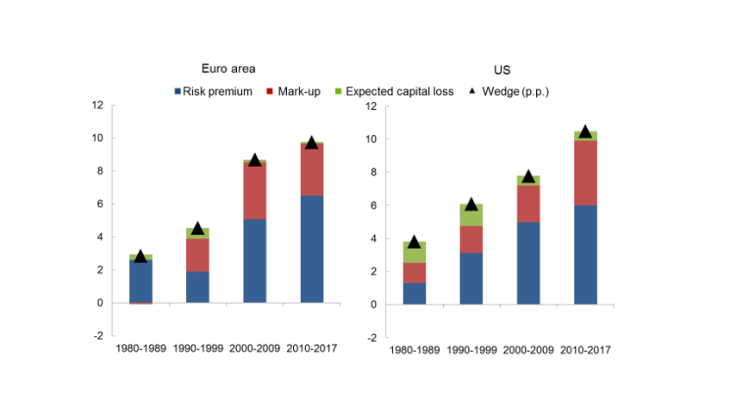
Using data for the euro area and the United States, we calibrate this framework to match the observed wedge between the pre-tax return on capital and the risk-free rate over 1980-2017. A number of interesting findings emerge (Chart 4). From around 2000, the wedge increased in both jurisdictions. In the euro area, this increase was driven for the most part by the risk premium (estimated as the return on physical capital that is in excess of the risk‑free interest rate having taken into account depreciation and the relative price changes of investment goods over time) and to a lesser extent by mark-ups. In the United States, it was primarily due to the increase in the risk premium. Since the crisis, the increase in the wedge in the euro area reflects a larger contribution from the risk premium. In fact, the contribution from mark-ups – while remaining important – declined. This may to some extent reflect the impact of crisis-related structural reforms. This contrasts with the United States where the increase in the wedge largely reflects an increase in mark-ups. The latter is aligned with empirical studies showing an increase in mark-ups over the last 30 years in the United States (De loecker and Eeckhout, 2017).


