- Home
- Publications et statistiques
- Publications
- Unemployment insurance: What can we lear...
Post n°105. A federal unemployment insurance scheme has been in place in the United States for more than 80 years. It has helped to cushion the effects of successive crises without the need for large fiscal transfers between American states. It provides an example of an unemployment insurance model based on temporary transfers and subsidiarity between federal and state governments.

The euro area does not yet have a common unemployment insurance system that could act as a stabiliser against macroeconomic shocks. A crucial point of contention in the project for a European unemployment benefit scheme is the size of the fiscal transfers it would imply and whether they should be temporary or permanent. What lessons can we draw from the US experience in this respect? Of course, euro area labour markets are more heterogeneous than in the United States. Nevertheless, the US system provides an example of a federal unemployment insurance system based on transfers between states. We highlight three key stylised facts.
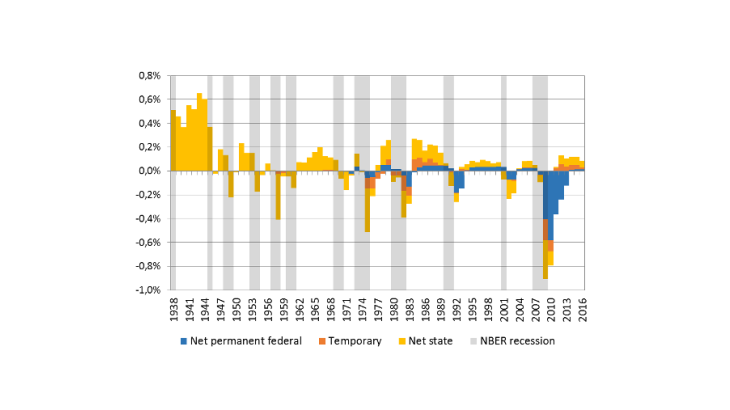
i) An unemployment insurance scheme based on the accumulation of reserves by individual states and temporary federal transfers could be a first step that would provide sufficient stabilisation outside periods of exceptional crisis. Chart 1 shows the highly counter-cyclical nature of net flows of state and federal benefit payments since 1938.
ii) Fears of massive fiscal transfers between states do not appear justified in light of the US experience: permanent federal transfers to net recipient regions via unemployment insurance have averaged 0.07% of GDP per year since 1970, and just 0.01% if we exclude the most recent crisis.
iii) Although some US regions have structurally been net contributors or net recipients vis-à-vis the unemployment insurance scheme, cumulative net fiscal transfers remain limited. Moreover, transfers are mainly made on a discretionary basis, following a decision by Congress.
An unemployment insurance system jointly financed by the states and the federal government
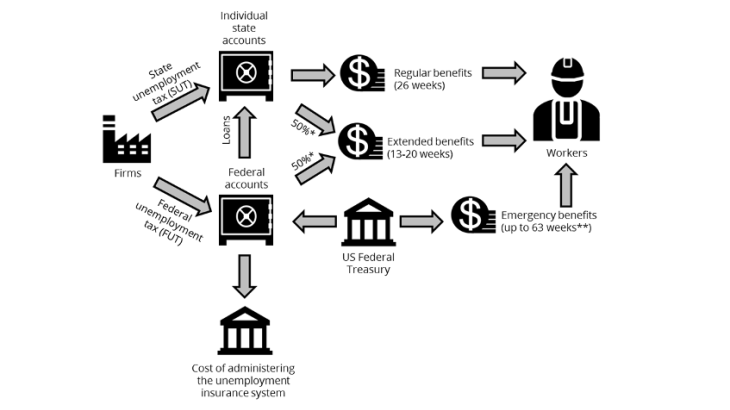
The US unemployment insurance system is made up of three modules, which makes it more adaptable during periods of crisis (Chart 2):

Note. The above diagram shows how the US unemployment insurance system is financed by firms and different levels of government. See below for more details.
i) Regular unemployment benefits provide a maximum of 26 weeks of compensation, without requiring any fiscal transfers from the federal level. They are paid from a reserve account each state holds with the Treasury, which is funded via a state payroll tax (State Unemployment Tax - SUT).
ii) A temporary transfer mechanism, in the form of a federal loan, enables regular unemployment benefits to be maintained when state reserves have been depleted. Federal transfers received in this way have to be repaid within two years, subject to financial penalties.
iii) Some unemployment insurance flows also imply permanent federal fiscal transfers, funded via a federal payroll tax (Federal Unemployment Tax – FUT). Initially, they only covered the administrative costs of each state unemployment insurance scheme. However, in the 1970s two programmes extending regular unemployment benefits were introduced. Extended benefits provide, under certain conditions, an automatic extension of unemployment benefits, co-financed by the state and the federal government. The Emergency Unemployment Compensation scheme can further extend benefits payments. It is activated at the discretion of Congress and entirely financed by the federal level. Emergency extensions have been enacted eight times since the 1970s.
Benefits are largely paid from the states’ own funds, except in the event of an exceptional crisis
The US unemployment insurance system acts as an automatic counter-cyclical stabiliser that helps the unemployed to smooth their consumption without placing an excessive burden on the finances of the worst-affected states.
Except in periods of severe crisis, it involves limited volumes of permanent transfers. Indeed, in the four recessions between 1970 and 2007, permanent transfers accounted for just 20% of net payment flows and averaged 0.01% of GDP per year. However, the scale of the 2008 crisis meant that regular unemployment coverage had to be extended to an unprecedented extent. As a result, between 2008 and 2013, total net transfers to households amounted to 2.3% of US GDP, of which 1.8% took the form of permanent federal transfers. The latter had never exceeded 0.4% of GDP during previous recessions.
Fiscal transfers between states via the unemployment insurance system have been limited
To measure the size of indirect fiscal transfers via the unemployment insurance system, we compute the cumulative net flow of payments received by each state since 1970 – this is calculated as the amount of FUT paid by each state’s firms to the federal fund, minus the flows received in the form of 1) administrative grants to state agencies; 2) automatic and discretionary permanent transfers; and 3) temporary transfers (federal loans) still to be repaid. We express these flows in dollars per capita at 2010 prices.
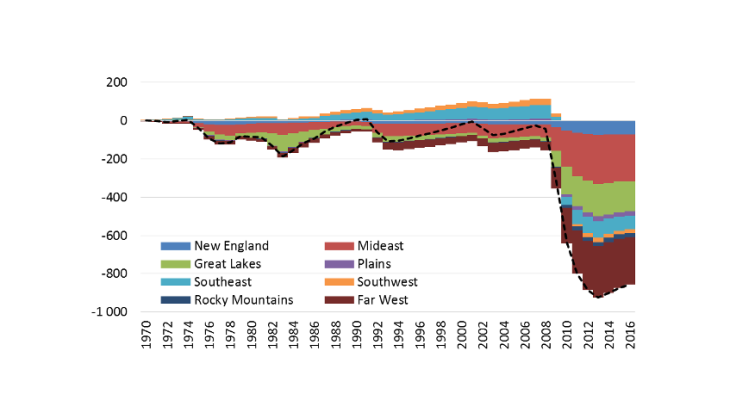
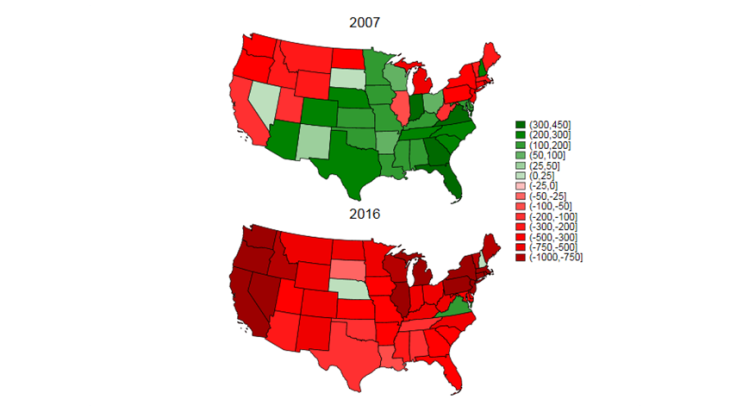
The charts below show the cumulative net flows for each of the eight regions defined by the BEA (Chart 3) and for each state (Chart 4). Two main stylised facts emerge. First, up to the Great Recession, the benefits paid at federal level tend to balance out against the contributions received over the cycle. In addition, cumulative net transfers remain relatively low, with overall deficits peaking at an average of around $100 (in 2010 dollars) per US inhabitant.

Second, between 1970 and 2007 some states were consistently structural recipients of (contributors to) federal unemployment insurance flows. The imbalance however appears to be limited, with an average annual transfer per capita of only -$25 (2010 dollars) for Rhode Island, the biggest net recipient, and +$11 (2010 dollars) for Virginia, the largest net contributor. This changed following the Great Recession, as permanent federal transfers surged to unprecedented levels (Chart 3).
The rise in post-crisis transfers was far from being automatic. Faced with the scale of the crisis, the US Congress implemented an emergency extension of unemployment benefits – which was renewed several times – resulting in the payment of $230 billion in permanent transfers. By the end of the crisis, nearly all states had become net recipients of federal flows on a cumulative basis (Chart 4). These supplementary transfers to workers directly affected by the crisis helped to cushion the impact on GDP. The Congressional Budget Office estimated in 2012 that a discretionary extension of unemployment benefits would most likely increase GDP by between $0.4 and $1.8 (or an average of $1.1) per dollar of budgetary cost. The transfers also helped to limit the social fallout of the economic recession: the US Department of Labor has indicated that 15% of the working population directly benefited from the emergency plan.

To conclude, if we exclude the exceptional dynamics of the recent period, the US unemployment insurance system has been effective in smoothing economic shocks, without leading to massive fiscal transfers between states. The US experience thus provides a model for a system based on temporary transfers and subsidiarity between federal and state governments.
Updated on the 25th of July 2024