Eco Notepad

The regulation of global systemically important banks has met its goals

Published on 17 July 2019
Authors : Dominique Durant, Oana Toader

Post n°123.Global systemically important banks (GSIBs) – those whose failure could adversely affect the economy – are subject to stricter regulations than other banks, leading them to curb the expansion of their balance sheets to a greater extent and resulting in a fall in their share of global bank assets. We show that, despite this, GSIBs have not reduced their lending to the economy. The G20’s goals have thus been met: GSIBs have been made more resilient to shocks without negatively affecting the financing of the economy.

Image Chart 1: Decline in GSIBs’ share of the total assets of large banks Source: S&P Market Intelligence – Sample of 97 large banks (34 of which were designated as GSIBs at least once over the period under review).
Chart 1: Decline in GSIBs’ share of the total assets of large banks Source: S&P Market Intelligence – Sample of 97 large banks (34 of which were designated as GSIBs at least once over the period under review).

From “too-big-to-fail” to global systemically important banks 

Following the collapse of Lehman Brothers, the G20 called for the implementation of measures to address the problem of large international banks whose failure could cause disruption to the financial system and to real economic activity. In November 2011, the Financial Stability Board identified 29 global banks deemed to be systemically important due to their size and complexity, the lack of readily-available substitutes for the financial services they provide to the economy, their interconnectedness with the financial system and the scale of their cross-jurisdictional activity. These banks were required to comply with stricter capital requirements than those set out in Basel III. A special system of oversight and supervision was also set up to prevent their failure or ensure their orderly resolution, and thus limit the need for government intervention.

Have the G20’s reforms achieved their objectives ?

Eight years after the first GSIBs were designated, it is useful to check whether the regulations have had the desired effect. We therefore attempted to assess to what extent the changes in GSIBs’ activities differ from those experienced by other large banks, taking into account initial structural differences between the two types of institution and the financial and macroeconomic events that have affected the countries where they are based. To do this, we analysed the balance sheets of 97 large banks in 22 countries over the period 2005-16, and identified the differences between GSIBs (34 banks designated as GSIBs at least once over the period under review) and other banks before and after 2011. We focused in particular on whether GSIBs have maintained their ability to finance the real economy.

GSIBs have expanded their balance sheets to a lesser extent than other banks

The Basel III framework, which also took effect as of 2011, required all banks, including GSIBs, to increase their leverage and solvency ratios. All financial institutions increased their own funds with a view to meeting these requirements, and GSIBs were no exception. However, GSIBs had much lower leverage ratios than other banks prior to 2011 and increased them at a faster pace in the period after this date (see Chart 2). They also curbed their balance sheet growth to a much greater extent than other banks, leading to a narrowing of the gap between the two categories. This was one of the objectives of the G20, as low leverage ratios can imply a need for government support.
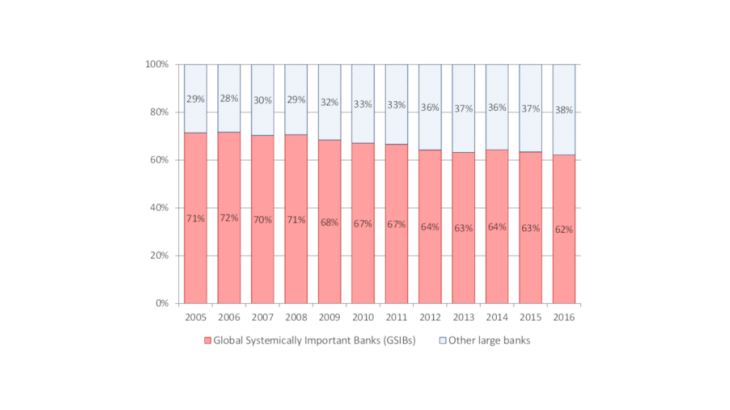
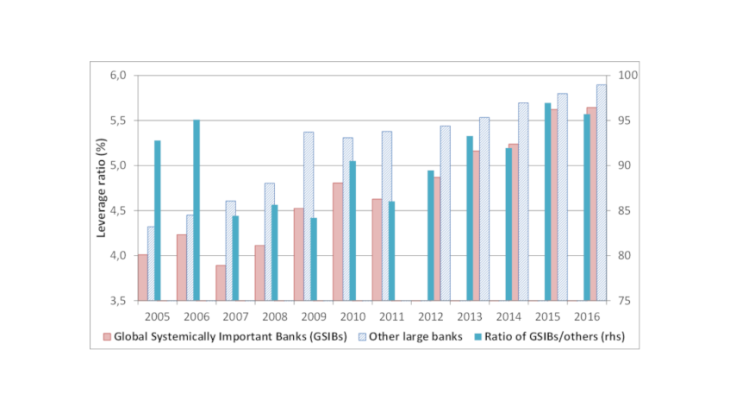
 

Image Chart 2: GSIB leverage ratios have converged towards those of other banks Source: S&P Market Intelligence – Sample of 97 large banks, including 34 GSIBs. This chart is confirmed by the difference-in-difference method.
Chart 2: GSIB leverage ratios have converged towards those of other banks Source: S&P Market Intelligence – Sample of 97 large banks, including 34 GSIBs. This chart is confirmed by the difference-in-difference method.

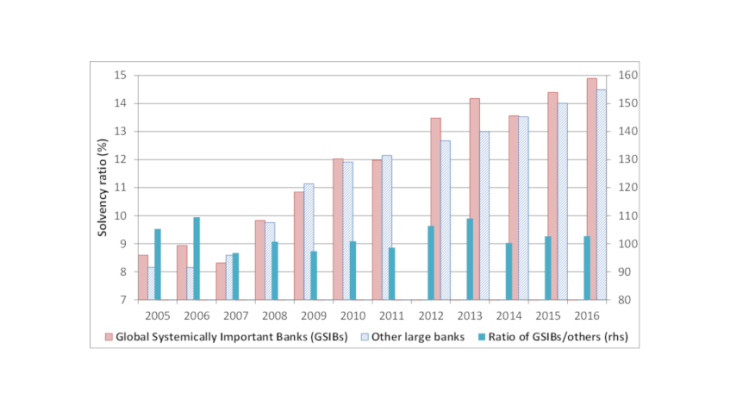
What seems paradoxical at first is that GSIBs have increased their leverage ratios even though their additional capital buffer is defined in terms of their solvency ratio (between 1% and 3.5%). There are two reasons for this: GSIBs already had higher solvency ratios than other banks before the crisis; and after 2011 the other banks raised their solvency ratios to above the minimum regulatory requirement (see Chart 3).

Image Chart 3: Solvency ratios have risen to similar extents for all banks Source: S&P Market Intelligence – Sample of 97 large banks, including 34 GSIBs. This chart is confirmed by the difference-in-difference method.
Chart 3: Solvency ratios have risen to similar extents for all banks Source: S&P Market Intelligence – Sample of 97 large banks, including 34 GSIBs. This chart is confirmed by the difference-in-difference method.

GSIBs have also increased their share of liquid assets more than other banks. As with the leverage ratio, this reflects a catch-up effect, with a view to complying with the new liquidity ratios introduced under Basel III and applicable to all banks. The same results can be found in the Basel III monitoring data provided by banks to the Basel Committee’s Secretariat.

The new regulatory constraints have had no adverse impact on the financing of the economy

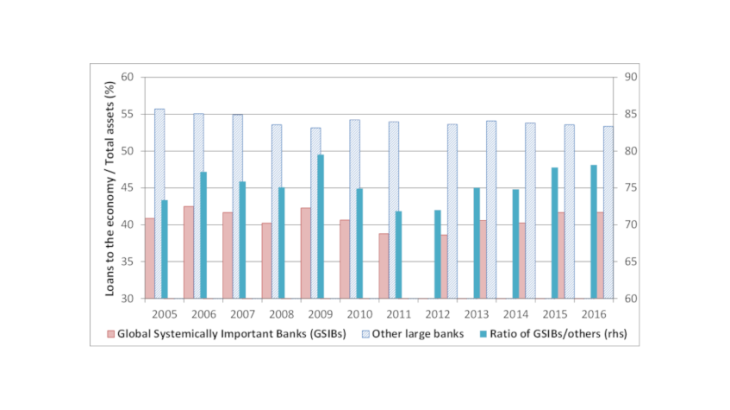
The sharp rise in own funds has led to a decline in GSIBs’ return on equity as their assets have only risen to a limited extent and the returns on these assets have remained stable. Nonetheless, the additional capital buffer imposed on GSIBs has not translated into a reduction in their issuance of loans to the economy: they still carry a similar share of these assets in their balance sheet as other banks. It is just the expansion of their balance sheets that has proved more limited. Moreover, the decline in their non-performing loan ratios (non-performing loans as a share of total outstanding loans) indicates that the new, stricter regulations have not prompted GSIBs to choose riskier assets in order to make up for the decline in their profitability.

Image Chart 4: The share of loans to the economy in GSIBs’ total assets has remained stable Source: S&P Market Intelligence – Sample of 97 large banks, including 34 GSIBs. This chart is confirmed by the difference-in-difference method.
Chart 4: The share of loans to the economy in GSIBs’ total assets has remained stable Source: S&P Market Intelligence – Sample of 97 large banks, including 34 GSIBs. This chart is confirmed by the difference-in-difference method.

Our results also show that, up to 2016, GSIBs still had access to cheaper funding than other banks. This may be related to the greater diversification of GSIBs which is linked to their size, or, as other articles suggest, to the existence of an implicit government guarantee. In this respect, the measures providing for the bail-in of creditors in the event of a bank resolution were mainly implemented after the period under review.