Eco Notepad

The income balance: a boost for France’s current account

Published on 30 September 2019
Authors : Sanvi Avouyi-Dovi, Pierre Bui Quang, Pierre Sicsic

Post n°134. The primary income surplus has been growing for several years. Since 2010, the increase of around EUR 10 billion in the income of French residents working abroad has been higher than that of direct investment (DI) income. The improvement in the income balance is now driven by employee compensation.

Image Chart 1: A significant improvement in the balance of compensation of cross-border commuters since 2010 Source: Banque de France’s Annual Report on the Balance of Payments. Note: primary income surplus expressed in billions of euro (EUR bn). PI: Portfolio investment; OI: Other investment
Chart 1: A significant improvement in the balance of compensation of cross-border commuters since 2010 Source: Banque de France’s Annual Report on the Balance of Payments. Note: primary income surplus expressed in billions of euro (EUR bn). PI: Portfolio investment; OI: Other investment

We observe a marked contrast between the DI balance and that of portfolio investment and other investment (Chart 1). Moreover, the improvement in the net surplus of cross-border commuter compensation as of 2008 continues unabated, even though it seems to have levelled off in the past two years.

The deterioration in the current account balance was less marked than that of the goods and services balance

The current account balance (Balance of Payments, July 2019) comprises the trade balance in goods and services and the primary income balance (income from the factors of production) and the secondary income balance (international aid, remittances, etc.). Here, we describe the main changes in the different components of the current account balance (Schmidt, 2018). In particular, we focus on changes in the compensation of cross-border commuters and the changes in the apparent rates of return to highlight a second specific feature of the French current account. These rates are calculated on the basis of DI income and inward and outward portfolio investment flows.

Since 2002, the deterioration in the current account balance has been less marked than that of goods and services balance, due to the fact that the increase in the primary income balance was stronger than the worsening in the secondary income balance (see Chart 2).

Image Chart 2: Improvement in the primary income balance combined with a persistent secondary income deficit Source: Banque de France’s Annual Report on the Balance of Payments. Note: balances expressed in billions of euro
Chart 2: Improvement in the primary income balance combined with a persistent secondary income deficit Source: Banque de France’s Annual Report on the Balance of Payments. Note: balances expressed in billions of euro

Some explanations may be put forward to try to understand this trend in the French position.

A steady rise in the compensation of cross-border commuters in correlation to their number

Within the primary income balance, net employee compensation has been steadily increasing. The latter mainly reflects the compensation of cross-order commuters (French residents working abroad) as that of foreign workers in France is relatively marginal. The number of cross-border commuters has risen by 12% in five years, increasing from 324,700 in 2010 to 363,700 in 2015 (Insee Première 1755, “Strong growth in the number of cross-border workers commuting to Switzerland and Luxembourg”. The average annual compensation of these employees, obtained by dividing the income of these employees by their number, rose from EUR 45,100 to EUR 58,300, displaying a very significant increase of almost 30% between 2010 and 2015. This “average” calculation could be improved by taking into account certain characteristics or specific features of this population.

France is a specific case in the euro area

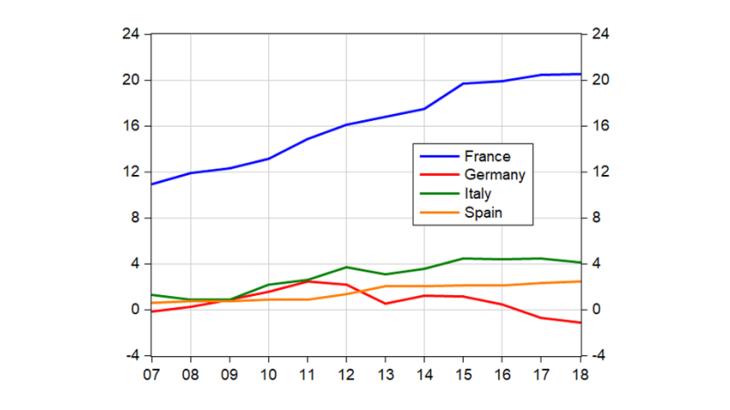
As a comparison, the net surplus of cross-border commuter compensation for France is far higher than that of other European countries for which an upward trend is not observed (see Chart 3). For example, contrary to popular belief, the balance of cross-border commuter compensation is close to zero for Germany: the "receipts", i.e. the compensation of German employees working abroad, offset the "payments" corresponding to the compensation of foreign residents working in Germany.
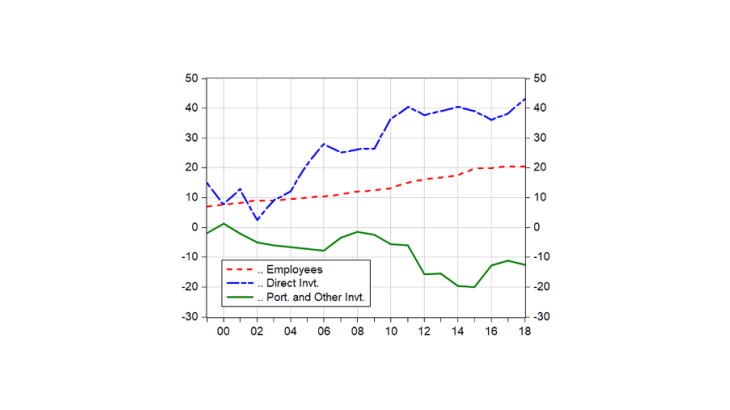
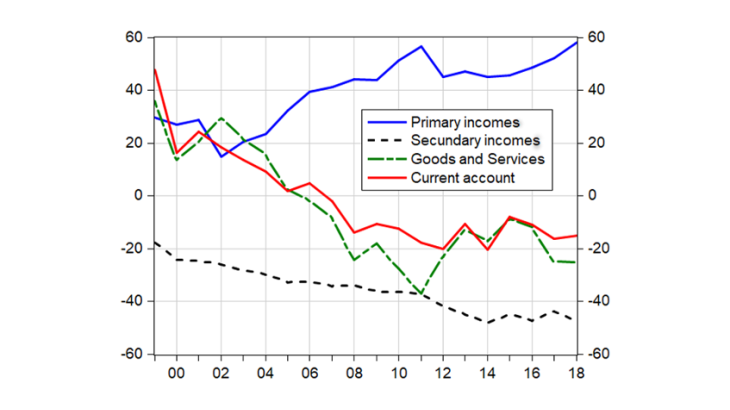
Image Chart 3: Steady rise in net cross-border commuter compensation, which is significantly more marked in France Source: SDW ECB. Note: balances expressed in billions of euro
Chart 3: Steady rise in net cross-border commuter compensation, which is significantly more marked in France Source: SDW ECB. Note: balances expressed in billions of euro

Apparent return on outward direct investment higher than that on inward direct investment

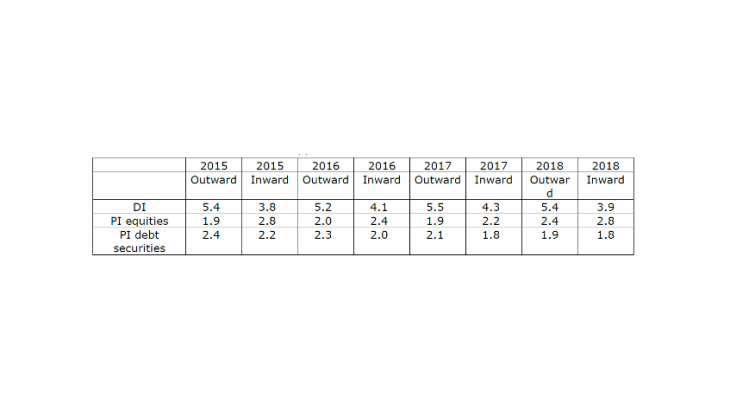
In France, does the improvement in excess returns on foreign assets stem from an increase in the differential in apparent rates of return?  Apparent rates of return can be derived from balance of payments and international investment position statistics. These are obtained by comparing income flows to the outstanding amounts of the corresponding assets. Consequently, they differ from the total return, which takes into account, among other things, changes in asset prices.

Image Table: apparent rates of return "Mixed” value of assets, i.e. accounting for the largest proportion of unlisted shares in direct investment.
Table: apparent rates of return "Mixed” value of assets, i.e. accounting for the largest proportion of unlisted shares in direct investment.

According to our calculations, over recent years, the apparent rate of return exceeds 5% for French outward DI; is close to 4% for inward foreign DI in France (see Table). In 2018, for example, the differential between the rates of return on “outward” and “inward” DI reached 1.5 percentage point (5.4% against 3.9%).

The levels and differentials of returns are significantly higher in the United States: 10% for receipts and 6% for payments according to Curcuru et al (2013). These authors find a differential of around two percentage points due to the differences in the way tax is taken into account. As a reminder, in the United States, earnings on assets are calculated after the payment of taxes abroad but before the payment of taxes on repatriated profits.

In a recent study, based on an international comparison, Vicard (2019) shows that the differential in the apparent rates of return is related to the corporate tax rate: multinational firms increase profits in subsidiaries located in low-tax countries. In the case of France, the improvement in excess returns on foreign assets cannot be ascribed to an increase in the differential in apparent rates of return but rather to the improvement in the international investment position (particularly net DI).