- Home
- Publications et statistiques
- Publications
- How has risk appetite fared since the st...
How has risk appetite fared since the start of the COVID-19 pandemic?
Post n°221. Assessing investor risk appetite is essential for financial stability and market analysis. This post looks at a risk appetite indicator developed by Banque de France staff and gives insights into its contribution to understanding market impact since the start of the COVID-19 pandemic.

Sources: Bloomberg, authors’ calculations.
Risk appetite, a measure of market sentiment
Risk appetite is defined as “the willingness of investors to bear financial risk with the expectation of generating a potential profit” (ECB, 2007). Risk appetite is thus dependant on the “subjective attitude of investors with regard to uncertainty” (Gonzàles-Hermosillo, 2008).
Assessing the level of risk appetite is essential for financial stability, but also market analysis as regards defining investment or asset allocation strategies. Periods of sudden risk premium spikes, reduced market liquidity and sharp asset price falls have often been associated with a loss of investor risk appetite (see Chatelais & Stalla-Bourdillon (2020) for more information on equity market valuation sources).
Volatility indicators such as the VIX (Volatility Index, fixed daily by the Chicago Board Options Exchange) in the US financial markets or the V2X (its European equivalent) do not fully capture investor risk appetite, which is based on more asset classes than just equity markets. This is why certain financial institutions (IMF), central banks (ECB, etc.) and investment banks have developed various indicators that are more informative (see also Petronovich & Sahuc (2019) on financial conditions).
What does the risk appetite indicator encompass?
The risk appetite indicator (RAI) developed by Banque de France staff is an average of z-scores (difference from the average expressed in the number of standard deviations) calculated: (i) based on prices of financial instruments, mainly in developed markets (Europe and the US in particular), but also in certain emerging markets, particularly Asian markets, and (ii) on spreads between these instruments. The core idea is to capture the flight from risk assets to safer assets (and vice versa) across six asset classes: equity, sovereign bond and credit markets, commodities, foreign exchange market and equity market volatility. Each asset class consists of a basket of representative financial variables. The aggregate indicator is calculated using data smoothed over three months.
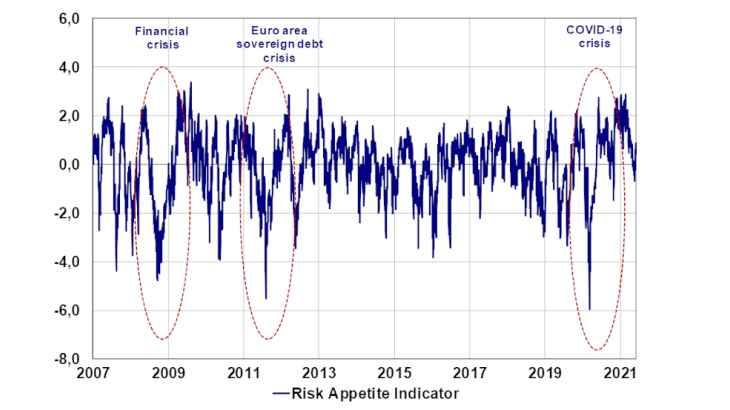
Three periods of sharp decline in risk appetite have been identified by our indicator since 2007 (Chart 2): during the 2008 financial crisis, the euro area sovereign debt crisis (2010-11) and the COVID-19 pandemic. While the magnitude of the fall in risk appetite was slightly higher during the COVID-19 pandemic than during the 2008 financial crisis or the sovereign debt crisis, risk appetite swung back into positive territory a little faster (four months compared with six months).

Source: Bloomberg, authors’ calculations.
The RAI's contribution to understanding the market impact of the COVID-19 pandemic
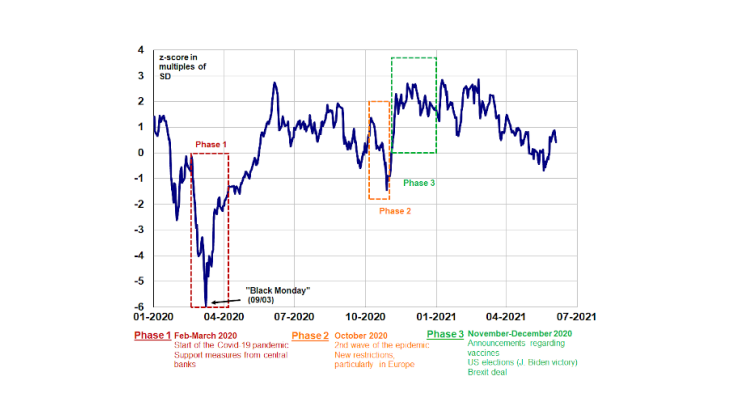
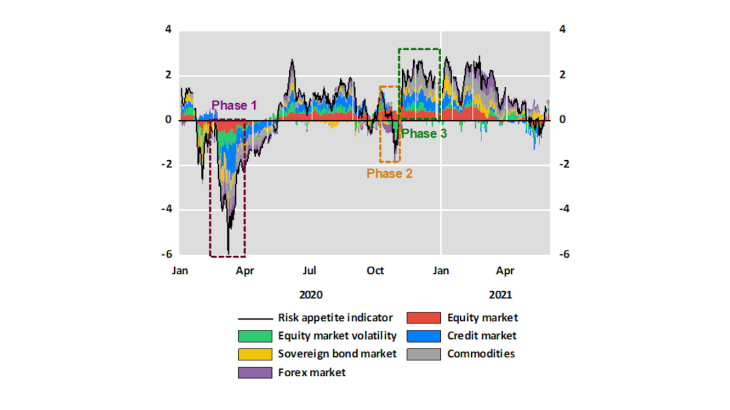
The risk appetite indicator makes it possible to capture the market impact of COVID-19 by analysing three separate phases during the pandemic, breaking down the contribution of each asset class to its change (Chart 3).

Source: Bloomberg, authors’ calculations.
Phase 1: late February-early March 2020 (peak of risk aversion)
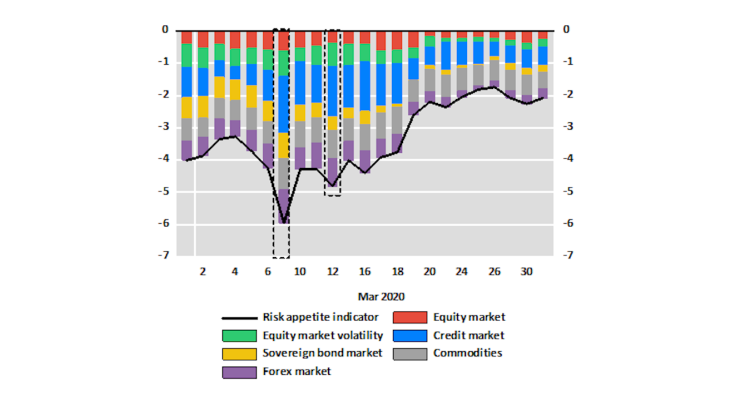
The COVID-19 pandemic was spreading across the world: economic activity had been put on hold due to lockdown measures put in place virtually across the globe. The sharpest correction for risk assets was seen on 9 March 2020 (“Black Monday”, Eurostoxx 50: -8.5%, S&P500: -7.6%). The risk appetite index captured this risk aversion movement and hit its low point in 2020 (Chart 4).
The breakdown of the RAI shows that the fall in risk appetite is the result of all components, with marked contributions from the credit market (widening credit spreads), the fall in equity markets and the peak in volatility: volatility indices hit their highest point since 2008 on Monday, 16 March (VIX at 82.7 and V2X at 85.6) on news of a series of lockdowns in Europe.
The announcement of support measures by the major central banks (Odendahl et al., 2020 and Penalver & Szczerbowicz, 2021) restored investor confidence and renewed risk appetite. In the euro area, the Eurosystem introduced various support measures (Grossman Wirth 2020), including the Pandemic Emergency Purchase Programme (PEPP) on 18 March 2020.
Phase 2: October 2020 (renewed risk aversion)
During the week of 26/10, the risk appetite indicator moved back sharply into negative territory, dropping to its lowest level since April before stabilising at a level well above its March low. This renewed risk aversion (VIX above 40 and V2X at 38) reflected the renewed uncertainty due to the upsurge in the epidemic, particularly in Europe, and announcements of restrictions and further lockdowns. The breakdown of the RAI (Chart 4) shows the very marked contribution of the "equity market volatility" component.
However, two differences are noteworthy compared with the sharp fall in March. Firstly, credit spreads widened only slightly and the fall in sovereign bond yields was much more restrained. Analysts feel policy measures helped to avoid a sharp upswing in risk aversion, despite further restrictions. Secondly, the “equity markets” component stayed in positive territory. Despite the correction seen in the US and European equity markets, Asian equity indices proved highly resilient.

Sources: Bloomberg, authors’ calculations.

Phase 3: November-December 2020 (renewed risk appetite)
Risk appetite rebounded spectacularly at the end of 2020 (Chart 3). This followed, on the one hand, the elimination of uncertainty surrounding the outcome of the US presidential election (victory of Joe Biden announced by several media outlets on 7 November) and, above all, the announcements relating to vaccine development (Pfizer-BioNTech on 9 November and Moderna on 16 November), marking a decisive shift in the perception of market sentiment underpinning the upswing seen at the end of 2020. This renewed risk appetite was reflected in a sharp rise in cyclical equities ("equity markets" component), a tightening of credit spreads and a rise in sovereign bond yields with a steepening yield curve in the US and, to a lesser extent, in the euro area ("sovereign bond markets" component).
Between January and mid-March 2021, the risk appetite indicator moved firmly into positive territory, close to its historical highs (Chart 2), driven by almost all its components. Since mid-March, it has generally moved about in positive territory, but at lower levels. This essentially reflects the absence of extreme movements in the main asset classes.
Updated on the 25th of July 2024