In the French overseas territories, weather-related disasters increase consumer prices by 0.5 percentage point after two months. Effects vary between goods and services: the prices of fresh products surge by 11 percentage points while the prices of services and manufactured products decline by 0.2 percentage point. Lower-income households are particularly exposed, as food accounts for a larger part of their consumption.

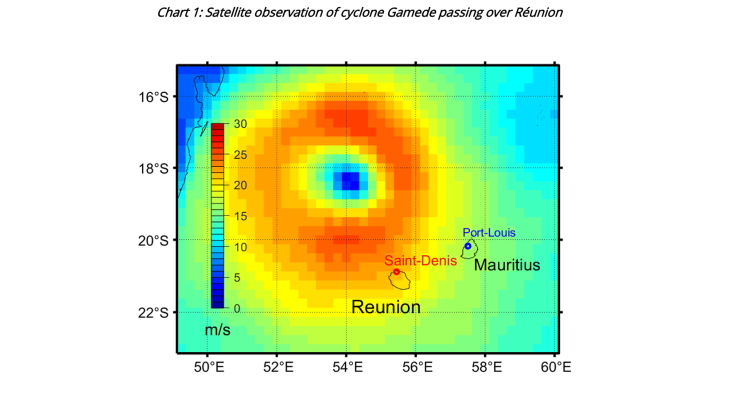
Note: Wind speed (in average metres per second for a six hour interval) of cyclone Gamede as it passed over Réunion on 25 February 2007. 1 m/s = 3.6 km/h.
Overseas territories are ideally suited to the study of the sectoral effects of weather-related disasters
The impact of weather-related disasters (floods, storms, extreme temperatures) on inflation is subject to increasing attention from policymakers, and particularly central banks (Ciccarelli et al., 2023; Kotz et al., 2023; Cevik and Tovar Jalles, 2023). However, while a range of studies consider the effects of such disasters on the average level of prices, few analyse their effects at a by-product granular level. Yet, weather-related disasters provoke a complex combination of supply and demand shocks, which does not affect the price of each product in the same way.
In this respect, the Départements et Régions d’Outre-Mer (DROM – French overseas departments and regions) are particularly useful as a case study for understanding the impact of weather-related disasters on prices. First, these territories are frequently exposed to extreme weather events: since 1965, they have been hit by more than one hundred “memorable events“ according to Météo-France. Furthermore, INSEE has published local consumer price indices for four of these overseas territories (Guadeloupe, French Guiana, Martinique and Réunion) for the last several decades. These indices are not available for the départements of metropolitan France. Gautier et al. (2023) make use of the frequency of extreme weather events and the availability of local price data in these four DROM to more precisely estimate the effect of these events on inflation between 1999 and 2018.
In this study, we combine administrative natural disaster data (from the EM-DAT international database and the GASPAR database, which lists declared natural disasters at the French municipal level), with satellite-collected meteorological data (see Chart 1). The combination of these data is intended to limit certain well-known sources of bias. Indeed, administrative data on natural disasters are subject to potential over or under-reporting, which depend on local economic conditions (Grislain-Letrémy, 2022). They can therefore take into account disasters that are not necessarily related to extreme meteorological phenomena. As for meteorological data, their use can be somewhat problematic as they do not mechanically provide any indication of the economic consequences of severe weather conditions: wind or rainfall only become destructive when the levels recorded exceed a certain threshold (the effects are non-linear), and the extent of the damages caused depends on the geological features and economic characteristics of the parts of the world where they occur. We combine these two types of data to isolate and select only those natural disasters resulting from extreme weather events.
A modest increase in consumer prices but with heterogeneous price responses across products
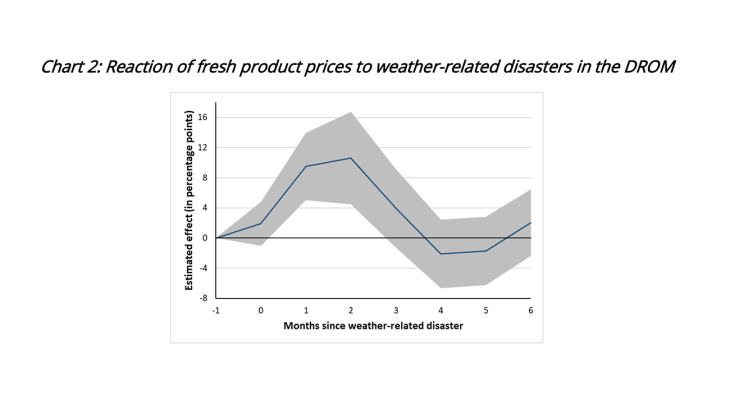
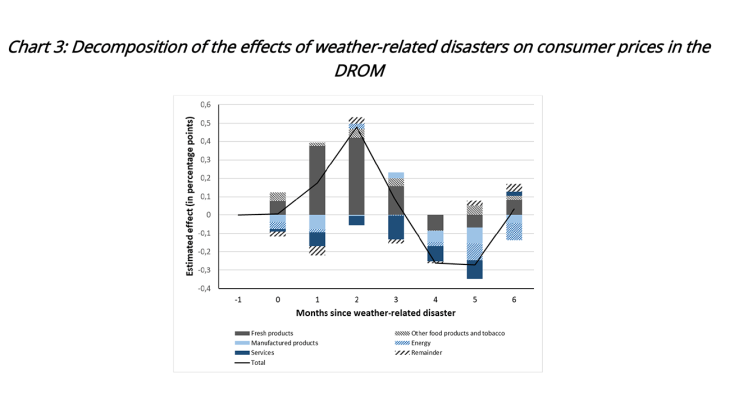
Weather-related disasters induce a temporary and modest rise in consumer prices, with a maximum increase of 0.5 percentage point after two months. The effects vary significantly between goods and services. On the one hand, food prices rise sharply (see Chart 2), particularly for fresh products (up 11 percentage points after two months, compared with a 0.3 percentage point increase for processed food). On the other hand, the prices of manufactured goods and services decline slightly by around 0.2 percentage point. Finally, the prices of energy and tobacco, mainly administered in the DROM, show no significant reaction to weather-related disasters. The granularity of consumer price data by product allows us to fully break down the effect for the various price index components (see Chart 3).

Note: Fresh product prices rise by 11 percentage points two months after a weather-related disaster’s occurrence. 95% confidence interval in shaded areas.
The rise in food prices most likely reflects a decline in available supply. Indeed, we observe a drop in employment in the agricultural sector, and a simultaneous rise in temporary work in other sectors. This is indicative of a displacement of agricultural labour to other low-skilled sectors, possibly due to the destruction of crops. While processed food is mostly imported, fresh products tend to be grown locally. The supply shock to locally grown products would thus be more pronounced, which would explain their stronger price reaction. Meanwhile, the decline in prices of manufactured goods and services does not appear to be linked with a significant change in employment. This is consistent with the fact that manufactured products are largely imported, which points towards the predominance of negative demand effects.

Note: Decomposition of the reaction of consumer prices to weather-related disasters in Guadeloupe, French Guiana, Martinique and Réunion.
Lower-income households more exposed and contrasting effects from the Bouclier Qualité Prix
As weather-related disasters have a greater effect on fresh products, their impact on households notably depends on the weight of food products in their consumption basket.
According to Insee’s 2017 Household Budget Survey, in the four DROM considered in this study, this share amounted to 21.1% for the lowest-income households (first income quintile), compared with 13.3% for the highest-income households (last quintile). To illustrate the consequences of this difference, we calculate a specific price reaction for each quintile, based on their own distinctive consumption baskets: for first-quintile households, prices would increase by a maximum of 0.6 percentage point after two months, compared with 0.4 percentage point for households in the top quintile of income distribution.
Furthermore, the downward trend in the weight of fresh products in the DROM (from around 6% in 1999 to 2% in 2018) means that prices now react more mutedly to weather-related disasters: if there had been no change in the share of fresh products since 1999, the effect on the overall consumer price index would have amounted to a maximum of 0.7 percentage point after two months.
Lastly, the reaction of consumer prices varies depending on the public policies implemented to control them. Since 2013, the DROM have been shielded by a price cap (the Bouclier Qualité Prix – BQP, the “price-quality shield”), which sets a price ceiling every year for a basket of first necessity goods (in which fresh products account for a significant proportion). We estimate that the introduction of the BQP helped to attenuate the fresh product price reaction, with a monthly effect of between 0 and 5 percentage points during the six months following a weather event. Nevertheless, at the end of this period the cumulated price responses with or without the BQP are comparable, suggesting that the price-cap regulation may slow the shock’s transmission, but does not reduce its total effect.
Download the PDF version of the publication
Updated on the 25th of July 2024