Post No.375. Companies’ cash holdings as measured at aggregate level in the monetary statistics are higher than before the Covid crisis. But according to our business survey, business leaders have a less positive perception of their individual situation than before. In this post, we suggest a reason for this: the abundant liquidity provided by SGLs may have led business leaders to revise upwards the cash position deemed necessary to carry out their activities.
Changes in the relationship between the cash position and responses to the MBS: 2019 vs 2022

Statistical data versus survey data: conflicting observations
We can make an initial assessment of the cash positions of French NFCs using monetary and financial statistics. We find that cash holdings – defined as the sum of bank deposits and deposits of money market funds – first increased considerably during the Covid crisis, in relation to the immediate hoarding of state-guaranteed loans (SGLs) granted in spring 2020.
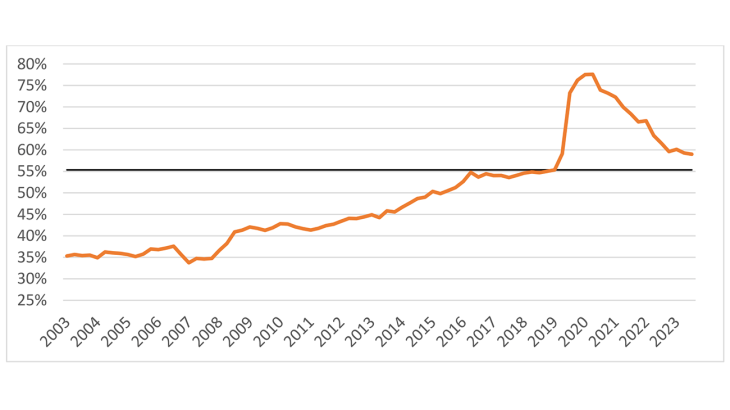
Chart 1. Aggregate cash holdings of non-financial corporations (% of the value added of NFCs)

Note: The dark grey line indicates the pre-Covid level. Value added is calculated over four rolling quarters.
Then, from 2021, on the back of the lifting of lockdown measures and the gradual recovery in economic activity, firms started to dissave some of these extraordinary cash holdings. This downward movement in NFCs’ cash position has continued for the past two years, meaning that, in relation to their value added (VA) – which, among other things, allows us to offset the effects of inflation – NFCs’ aggregate cash position has fallen from its 2021 peak (Chart 1). However, in mid-2024 the aggregate cash position of NFCs was slightly higher than its pre-Covid level, by around 3.6 points of VA.
In addition, each month the Banque de France surveys a sample group of around 8,500 companies to have a snapshot of the economic situation in real time and of business leaders’ perception of it. In this monthly business survey (MBS), business leaders are asked to give their opinion on the cash position of their company compared with a level considered “normal” at the time of the survey. The responses, which are collected in qualitative form, are then aggregated into a balance of opinion which reflects NFCs’ aggregate perception of their cash position.
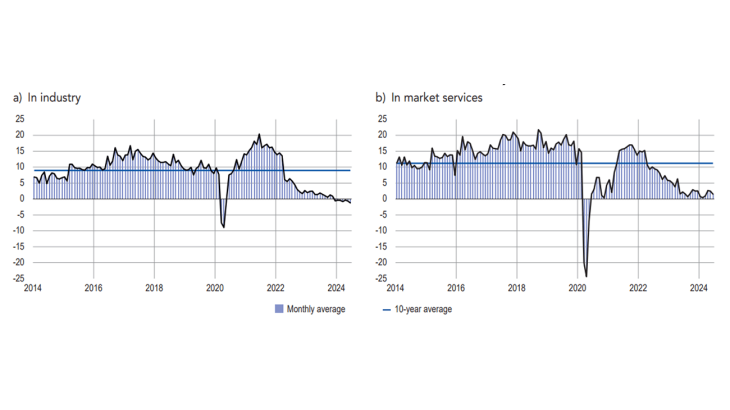
Chart 2. Cash position in the monthly business survey (balance of opinion, adjusted for seasonal and working-day variations)

Note: The balance of opinion is the difference between the proportion of respondents expressing a positive opinion and the proportion of respondents reporting a negative opinion.
The assessment provided by the MBS presents a very different picture from that offered by the monetary and financial statistics. The balance of opinion clearly shows a significant improvement in business leaders’ perception of their cash position after the sharp fall at the start of 2020, although this is mainly in industry. It is also possible to see how business leaders gradually considered that their cash position was becoming less and less satisfactory, to the point of falling below the long-term average of the balance of opinion in 2022. In particular, the balance of opinion has hovered close to zero for several months – a level we haven’t seen for at least ten years. This means that there are almost as many companies that deem their cash position to be satisfactory as ones that consider it to be insufficient.
In other words, business leaders’ perception of their cash position offers a much more negative picture than that provided by aggregated monetary and financial statistics. How can we explain this difference? It can be partly attributed to a number of technical reasons (scope, concepts, nature of the data). For example, the MBS questions 8,500 companies and the responses are declarative and qualitative, whereas the monetary statistics directly measure the cash position of all NFCs. Therefore, the balance of opinion reflects the distribution of business leaders’ responses and is not a direct measure of the cash position in euro like the aggregated statistics.
Notwithstanding these differences, we hypothesise that, owing to the many shocks experienced over the past four years – such as the Covid crisis, war in Ukraine, inflation surge, rate increases and supply difficulties – companies have significantly increased the cash position they deem satisfactory for carrying out their activities.
Business leaders have revised upwards the cash position they deem necessary to carry out their activities
We test this hypothesis by collecting granular statistics on corporate deposits (current accounts, term deposits, passbooks) held with large French banks. We cross-referenced the data collected with the individual data from the MBS and the company balance sheets available in Fiben. It should be noted that the intersection of these three datasets contains a relatively limited number of companies – around 470 – and these mainly come from the services sector. However, the median cash position is 56 days of turnover, which is not too dissimilar to the findings based on companies’ 2022 balance sheets.
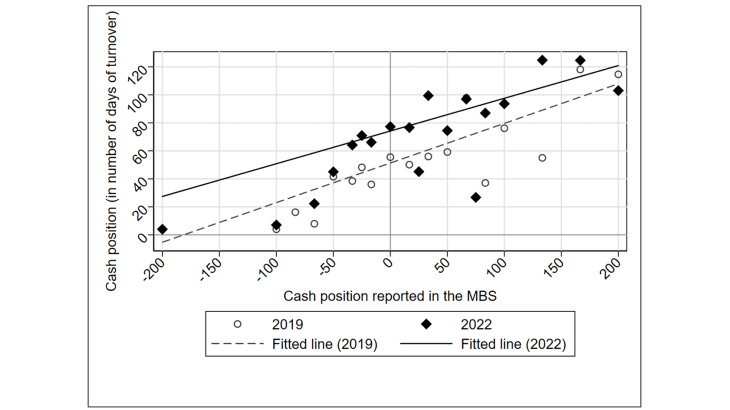
We can analyse the correlation between the qualitative responses of business leaders and the quantitative data on the deposits of their companies by regressing the individual MBS responses on the individual cash positions from the granular collection for 2019 and then 2022. We then see that the slope of the fitted line is very similar (0.28 in 2019 versus 0.23 in 2022): companies reporting a strong (weak) cash position in the MBS are also those for which we observe strong (weak) deposits in the granular data. Conversely, in line with the assumption that business leaders have revised the normal cash position, we find that the intercept increases significantly between 2019 and 2022, from 51 days of turnover to 74. In other words, assuming the same balance of opinion on the cash position is reported in the MBS, a company will have a larger cash cushion (in days of turnover) in 2022 than in 2019.
Chart 3. Changes in the relationship between the cash position and the responses to the MBS: 2019 vs 2022

What’s behind the change in companies’ perception of an adequate cash position?
This phenomenon could initially be attributed to a form of short-term bias, with the abundance of liquidity flowing from the massive SGL scheme skewing business leaders’ perceptions in the short term. It could also reflect the fact that some companies find themselves with a greater liquidity need as a result of the heightened uncertainty, consistent with the traditional precautionary motive (Keynes, 1936; Opler et al., 1999): the higher normal cash position would thus correspond to a level that would allow the company to absorb potential shocks in an environment of uncertainty amplified by the many events that have beset the world economy over the past four years.
It is also possible that this change stems more from the so-called transaction motive (Baumol, 1952; Miller and Orr, 1966): with the cost of financing becoming more expensive, an improved cash position helps minimise the impact on transactions, at least in the short term. Finally, the change in the necessary cash position could be due to the differentiated effects of inflation on input prices and selling prices and to different trends in trade payables and trade receivables, which increase companies’ working capital needs.
Ultimately, the upwards revision to the cash position considered necessary by companies probably owes to a combination of these factors rather than a single cause. However, our findings from Chart 3 could reflect not only a simple change in the cash position perceived as adequate by companies, but also the fact that companies assess their cash position net of SGLs.
To have a better idea of which of these hypotheses is true, we will need to see whether this change in the cash cushion considered necessary by business leaders persists over time, particularly when most of the SGLs have been repaid in 2026.
Download the PDF version of the publication
Updated on the 18th of November 2024