The sudden shock of the Covid-19 crisis – with some countries shutting down almost entirely in a matter of days – has put new emphasis on high-frequency data. Weekly, daily, or even hourly data have been extensively used to assess in real-time the impact of the pandemics. In particular, satellite measurements of air pollution have been put forward on several occasions to show the alleged dramatic effect of the shutdown of factories on air pollution.
Against this background, we assess whether satellite data for tropospheric pollution can help predicting industrial production. We focus on nitrogen dioxide (NO2), a pollutant mainly emitted by industrial activity. Compared to official or alternative indicators, such data present advantages of timeliness, global coverage – including over developing countries with limited official statistics, granularity, and free use. While an avenue for future research could be to compare predictive performances of NO2 satellite data with other high-frequency indicators, the global and uniform coverage of satellite data appears a key advantage.
Raw satellite data are however far from ready-to-use. Our first step is fetching the data and making it easier to process: we select and aggregate relevant data at ZIP code, allowing to go from a daily download of 4 Gb in multiple files into a single 20 Mb csv file. As the quality of satellite data can be altered over cloudy or snowy areas, we also clean the data. This results however in a large amount of missing points. Since missing data at local level might result in undesired composition effects when aggregating at national level, we interpolate them. We rely on a machine learning technique (the k-nearest neighbours’ algorithm) that allows interpolation to account both for spatial and temporal correlations. Finally, NO2 pollution heavily depends on meteorological factors (temperature, wind, humidity). Given that their effect is non-linear and features interactions between variables, we use a random forest algorithm. Data is then aggregated at national level to match the granularity of official statistics, most notably the industrial production that we intend to nowcast.
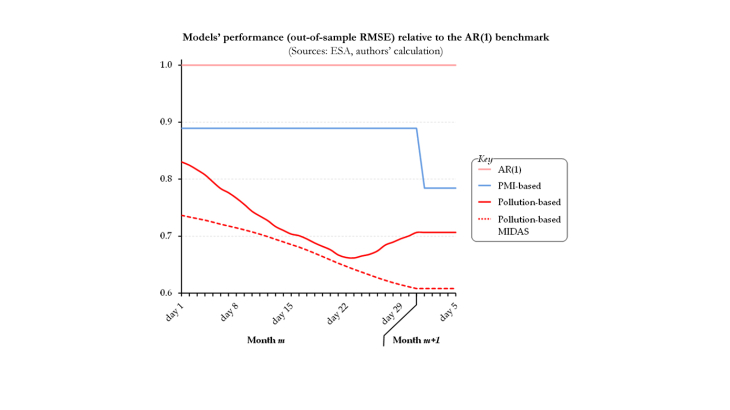
Our second step checks the relevance of NO2 pollution from a forecasting standpoint. We rely on panel regression over 17 emerging and 16 advanced countries to make up for the limited available timespan (since Dec. 2018 only). We find evidence that a model based on daily NO2 pollution data over-performs benchmark models based on survey data (Purchasing Managers’ Index) or auto-regressive (AR) terms. Mimicking a real-time set-up from March 2020 to December 2020, we find that this over-performance holds for all days of the month: the model based on daily NO2 pollution data over-performs benchmarks at every day – with evidence that gains in predictive accuracy are greater as the month advances and more daily data become then available (see figure 1). There are additional accuracy gains when relying on a MIxed DAta Sampling (MIDAS) approach to predict monthly industrial production using daily NO2 pollution – using a panel-MIDAS recently introduced in the literature.
We finally find evidence for heterogeneities. First, accuracy gains are greater for countries that have been more affected by the Covid-19 crisis, suggesting that the contribution of high-frequency data is more important during “crisis” episodes than during “normal” times. Second, the elasticity of pollution to industrial production appears to be greater for countries with a larger share of manufacturing in the value added. In the end, we turn to business cycle detection. Building on a Markov-switching framework, we find that daily NO2 pollution data allow for a swifter detection of turning points compared with relying on monthly official data, with a lead time of around 2.5 months for the former over the latter.
