Banque de France Bulletin

Why have strong wage dynamics not pushed up inflation in the euro area?

Published on 10 October 2019

Bulletin n°225, article 6. The recent weak core inflation in the euro area, despite a steady decline in unemployment since 2013, has led some analysts to doubt the existence of a Phillips curve. Wage developments, however, are consistent with their historical relationship with unemployment. This article proposes a novel decomposition of core inflation to explain the apparent absence of transmission of labour cost to inflation since 2017. We show that the increase in labour costs has been offset by a decrease in the margin rate and an improvement in the terms of trade excluding energy and food on the back of the appreciation of the euro. An increase in the price of construction investment relative to the price of consumption has also contributed to the apparent disconnection between labour cost and inflation: the dynamism of domestic prices thus concerns the price of construction more than that of consumption.
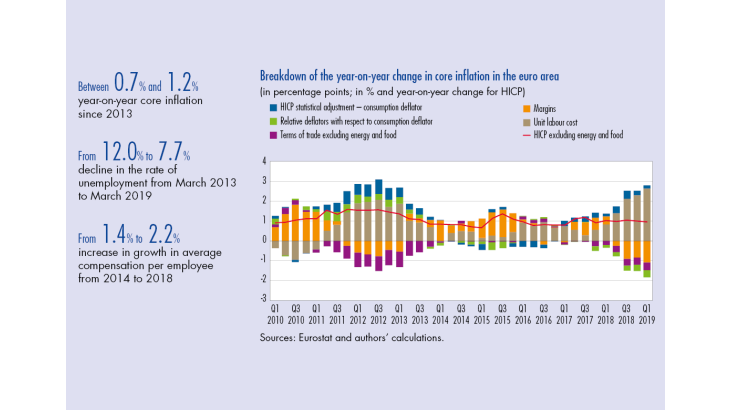
Image Breakdown of tghe year-on-year change in core inflation in the euro area Description The graph presents the breakdown of tghe year-on-year change in core inflation in the euro area from 2010 to 2019, with 6 criteria: - HICP statistical adjustments - consumption deflator - relative deflators with respect to consumption deflator - terms of trade excluding energy and food - margins - unit labour cost - HICP excluding energy and food Key figures: Between 0.7% and 1.2%: year-on-year core inflation since 2013 From 12.0% to 7.7%: decline in the rate of unemployment from March 2013 to March 2019 From 1.4% to 2.2%: increase in growth in average compensation per employee from 2014 to 2018

Why has inflation in the euro area remained so weak despite the dynamic upturn in activity since 2014? For several years, core inflation, measured by the Harmonised Index of Consumer Prices (HICP) excluding energy and food, has hovered around 1%, a low level compared to the pre-crisis period. Core inflation, shown by the blue curve in Chart 1, has fluctuated between 0.7% and 1.2% year-on-year since 2013, whereas the 2000-07 average was 1.6%. This inertia contrasts with the dynamism of the economic recovery, which has resulted in a sharp reduction in unemployment since 2013, from 12.0% of the labour force in March 2013 to 7.7% in March 2019.

As Chart 1 shows, this disconnection between unemployment and core inflation is a recent phenomenon (the green curve shows the unemployment rate, using an inverted and normalised scale to facilitate comparison with the inflation rate). This has led certain analysts to declare that the “Phillips Curve” – the historical statistical regularity between price movements and the level of economic activity – is dead. However, the economic upturn and the recovery in the labour market have led to a sharp acceleration of wages. Growth in average compensation per employee year-on-year thus accelerated from 1.4% in 2014 to 2.2% in 2018, in line with the historical relationship between unemployment and compensation shown in Chart 2.

Why has this wage increase not been passed through to core inflation? This article proposes a novel decomposition of core inflation to shed light on the factors at work in the apparent absence of transmission.

[To read more, please download the article]