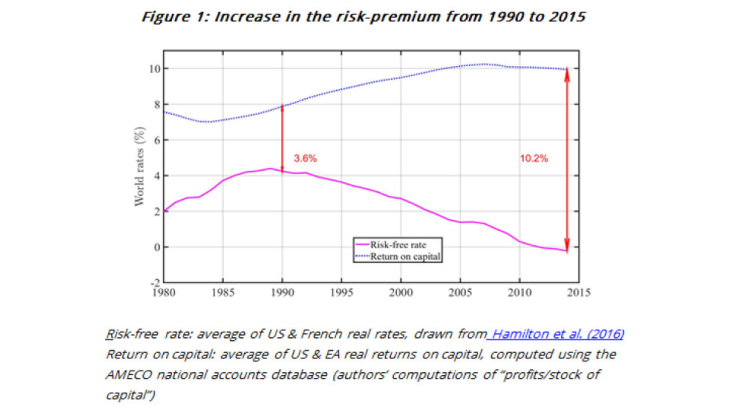
A worldwide abundance of savings due to the retirement of OECD “baby-boomers” and the Chinese “one child policy” is the best intuition behind the fall in long-term real interest rates, from around 4.5% in 1990 to around 0% since 2015. By contrast, the return on capital, defined here as profits over the stock of capital, , if anything, increased from 1990 to 2000 and remained stable around 10% until 2015. This increase in the risk premium from around 3.5% to some 10% (see Figure 1) is puzzling because an increasing gap between savings and investment should affect all returns similarly according to most macroeconomic models.
A model that embeds all the “usual suspects”
Marx, Mojon and Velde (2017) develop a specific model to understand why interest rates have fallen far below the return on capital. The model includes the main ingredients of the debate on secular stagnation:
- demographics because the aging of OECD baby-boomers and the Chinese population could explain an increase in savings world-wide,
- trend productivity because it determines wealth and savings over the long run,
- time-varying credit constraints in order to account for the post crisis deleveraging hypothesis,
- two assets, capital whose return is uncertain and debt whose return is “safe”, or at least much less uncertain than the one on capital.
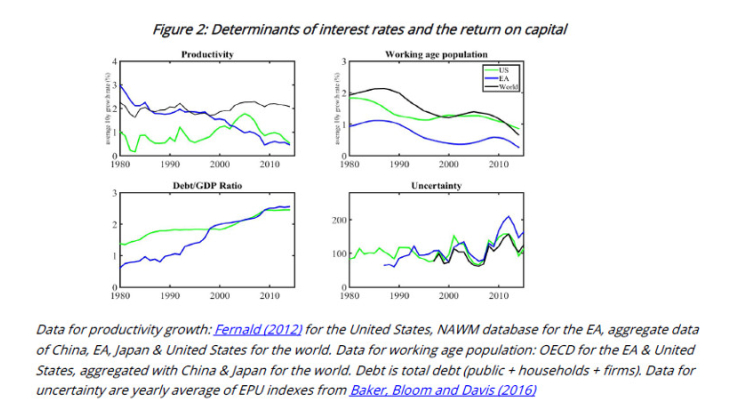
One factor that can explain the growing risk premium reported in Figure 1 is a change in the perception of risk, which in the model, takes the form of uncertainty on the growth rate of productivity. We show that even a moderate increase in the standard deviation of the year-on-year growth rate of productivity, from 0.08% to 0.1%, can explain the fact that the difference between the return on capital and the real interest rate has increased from 3.6% to 10.2%. In other words, for an average long term growth rate of productivity of 2% (see the upper left hand panel of Figure 2), a growth rate somewhere between 1.8% and 2.2% leads investors to hold a much larger proportion of “safe asset/debt” in their portfolio than if this growth rate fluctuates between 1.84% and 2.16%. In the former case, the uncertainty on how fast the economy will grow in the foreseeable future is larger, and the demand for safer assets is pushing down interest rates by several percent.
Interestingly, once the effect of rising uncertainty on growth is taken into account, the equilibrium interest rate falls even without any deleveraging. Indeed, according to our model, explaining a 3 % fall in real interest rates only by deleveraging would require that debt be halved since 1990. This is in sharp contrast with the data. Indebtedness over GDP actually increased (see Figure 2, bottom left hand panel). In addition, such deleveraging would explain only a 1% increase in the risk premium, a small contribution to the 6.5% increase that we see in the data (see Figure 1). These results invalidate a widely held view, for instance by Paul Krugman, that the deleveraging mainly explains the fall in the real rate.
Turning to the other “usual suspects”, aging (i.e. the decline in the rate of growth of the working age population from 2% in the 1990s to 0.7% today: black line in Figure 2 upper right hand panel) accounts for a decline of 1.2% in the world real interest rate. World productivity (Figure 2 upper left hand panel) remains rather stable and hence cannot contribute to explaining a fall in real interest rates.
Our results are derived from a model embedding overlapping generations and somewhat richer preferences than in textbook macroeconomic models. We use the so-called “Epstein-Zin preferences” where life-cycle behaviour and attitudes toward risk can be independent of one another. In particular, households will consume less and save more if either demographics or productivity reduces the growth rate of the economy; when credit constraints are more binding, i.e. when agents must reduce their indebtedness, interest rates will fall; lastly, if households are more uncertain about the growth rate of productivity, they will not only save more but hold a smaller proportion of their savings in the form of capital, such as physical investment, in favour of deposits or bonds.
As shown above, the model allows us to quantify the contribution of each factor to the 4.5 % fall in the ten year average real interest rates since 1990. In this post, we focused on a simulation of a world economy that aggregates China, the euro area, Japan and the United States using GDP weights. As shown in Marx, Mojon and Velde (2017) the main patterns are quite similar if we focus instead on the euro area or the United States.

