Eco Notepad

Which factors explain the variations in the carbon footprint of French equity funds?

Published on the 31st of January 2025
Authors : Dilyara Salakhova, Vincent Guégan

Post No. 385. The authors would like to thank Kirill Usachov for his work as a research assistant on the first version of this study.
The French financial sector must support the transition to a low-carbon economy by managing the associated risks and by contributing to financing it. Between 2017 and 2022, French equity mutual funds halved their carbon footprint, mainly favouring companies with lower emissions. However, the decline in absolute emissions by companies held had a limited impact. 

Chart 1: GHG emissions (Scope 1&2) of equity fund portfolios, 2017-22

Image 385-Which-factors-explain-the-variations-in-the-carbon-footprint-of-French-equity-funds-1
Sources: ISS- ESG, OPC database, Banque de France calculations.
Notes: Right-hand chart: Emissions intensity in tonnes of CO2e emitted per EUR million of nominal revenue. GHG –.greenhouse gas. CO2e - CO2 equivalent emissions.

Investment funds, like other financial institutions, must manage the financial risks associated with climate change and contribute to financing of the transition to a low-carbon economy. In order to achieve the European Union's goal of carbon neutrality by 2050, non-financial and financial corporations must take action to reduce their emissions. In this blog post, we focus on equity mutual funds domiciled in France with at least 80% of their portfolios invested in equities of French and foreign firms. In 2022, the assets under management of the funds in our sample totalled EUR 240 billion, i.e. around 63% of the total assets of equity mutual funds domiciled in France. This study analyses the changes in portfolio carbon footprint of these funds over a six-year period, from 2017 to 2022, and identifies the factors behind these changes.

The financed emissions of all the funds together, i.e. the sum of the investee companies' emissions weighted by the investor’s share in the total value of the companies in the portfolio, decreased by nearly 50% between 2017 and 2022. The majority of this reduction occurred between 2017 and 2020, followed by a period of relative stabilization (see Chart 1, left). The decline in financed emissions is not linked to the reduction in the amount of assets under management. Indeed, between 2018 and 2021, assets under management increased while financed emissions decreased. 

In terms of the portfolios emissions intensity, i.e. the Weighted Average Carbon Intensity (WACI), that is calculated as the weighted average of each company’s absolute emissions divided by its revenue, the decline primarily occurred after 2020 (see Chart 1, right).  

Chart 2: Breakdown of annual variations in emissions intensity by factor, 2017-22 (in tonnes/EUR million)
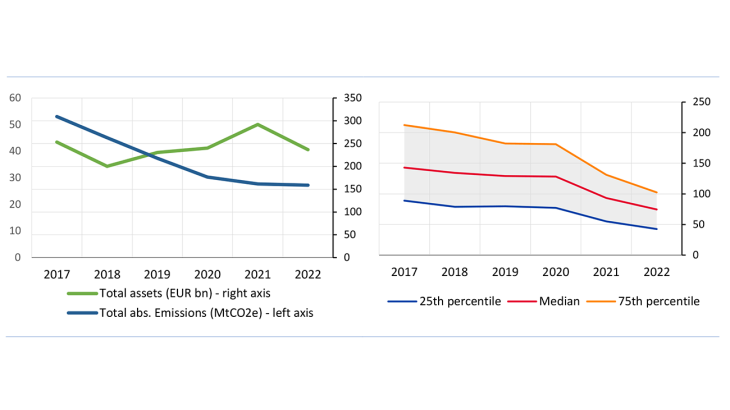
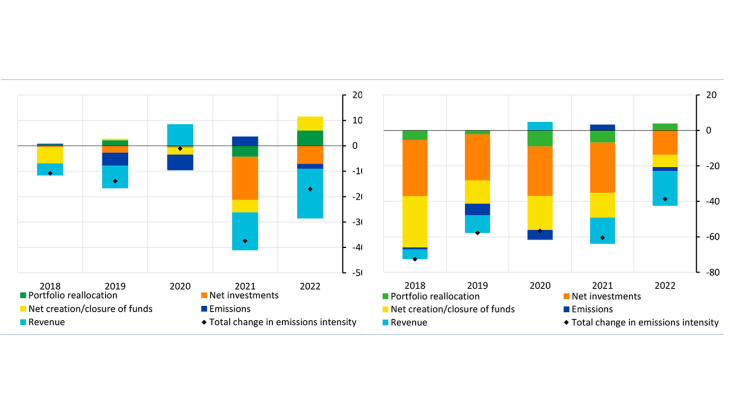
Image 385-Which-factors-explain-the-variations-in-the-carbon-footprint-of-French-equity-funds-2
Sources: ISS- ESG, OPC database, Banque de France calculations.
Notes: tonnes of CO2e emissions per EUR million of earnings for the whole sample (left) and for the sample of funds that reduced their emissions intensity (right).

Changes in the portfolio emissions intensity are primarily driven by variations in company revenue and investment (purchase of new securities) or divestment (full sale of assets held) strategies (see Chart 2, left). In order to achieve the net-zero emissions target for the economy, the reduction in portfolio emissions will have to be driven by the reduction in corporate emissions (shown in dark blue in the charts above). Nevertheless, this factor remains limited over the period as a whole, with the exception of 2020 due to the effect of Covid-19 and the decline in global economic activity. That year, the fall in corporate earnings led to an increase in their carbon intensity, as well as that of the funds, almost entirely offsetting the reduction in emissions. In 2021, the rise in nominal earnings, partly linked to the inflationary context, explains 38% of the decline in the funds' emissions intensity, i.e. almost 12 of the 31 tonnes of CO2e per EUR million of this fall. At the same time, divestment, i.e. the sale of all the shares in a company held by a fund, accounted for 42% of the reduction, or 13 tonnes of CO2e per EUR million, and was a major factor in the drop in emissions as of 2021.

The decrease in fund emissions intensity can be explained mainly by two factors: changes in the composition of the funds in the sample (in yellow in the charts above) and changes in the companies within these funds' portfolios (in orange) (see Chart 2, right). From 2017 to 2022, the net creation or closure of funds and net investment in companies contributed an average of 43% and 28% respectively to the reduction in the emissions intensity of our sample as a whole, i.e. 29 and 19 tonnes of CO2e per EUR million, respectively. 

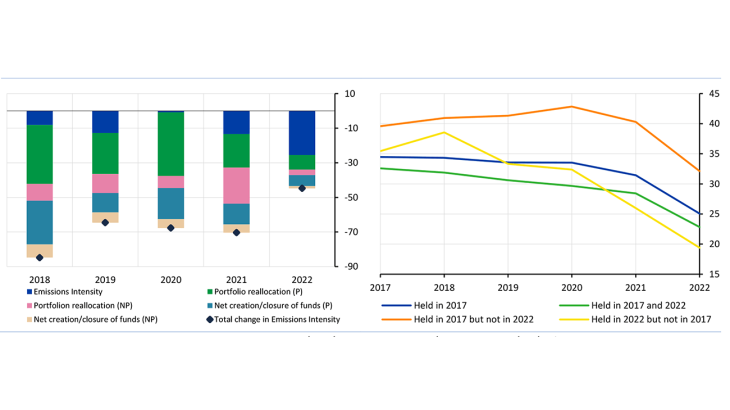
Chart 3: Net divestment of polluting companies as the main factor in reducing the carbon footprint and emissions intensity of companies held, 2017-22

Image 385-Which-factors-explain-the-variations-in-the-carbon-footprint-of-French-equity-funds-3
Sources: ISS- ESG, OPC database, Banque de France calculations.
Notes: left: Portfolio Emissions intensity (WACI) broken down for funds that have reduced their emissions intensity by shifting the composition of their portfolios from polluting (P) companies to non-polluting (NP) companies. Right: Emissions intensity for a median firm held by the funds over the period under review.

The net investment and net creation or closure of funds that have reduced their emissions intensity - nearly 50% of the sample - are then broken down into polluting and non-polluting companies, defined in relation to the median absolute GHG emissions in their respective sectors (see Chart 3, left). These funds have mainly reduced their emissions, particularly before 2021, by lowering their exposure to the most polluting companies (24% reduction in emissions intensity on average). Furthermore, the funds closed before 2021 held a higher proportion of polluting companies and their closure therefore contributed to the reduction in the emissions intensity of the sample. 

The companies owned by the funds that reduced their emissions intensity are different from those that the funds sold (see Chart 3, right). Indeed, companies held by the funds in 2022, whether or not they were held in 2017, exhibit both a lower emissions intensity and a downward trend compared to companies held in 2017 and sold before 2022. Trends in the absolute emissions of companies held by the funds between 2017 and 2022 are similar.

To achieve net-zero emissions by 2050, the financial sector needs to focus on reducing absolute emissions in the economy. While selling carbon assets can reduce the climate risk of individual portfolios, it does not guarantee a transition to a low-carbon economy (Bolton et al., 2022). Indeed, companies need financing for this transition (Carradori et al., 2023), and divestment is not enough to increase the cost of capital and prompt change, even for fossil fuel companies (Hansen and Pollin, 2020; Platinga and Scholtens, 2020; Zori et al., 2022). Financial institutions must therefore commit to working with the companies in which they invest in order to guarantee a real reduction in emissions. This strategy is recognised as being more effective (Kölbel et al., 2023). Asset managers must also put in place rigorous transition plans, invest in activities that are aligned or aligning with the transition and define a clear divestment strategy to encourage companies to act.

Updated on the 31st of January 2025