Post n°189. Despite the corrections at the end of 2018 and the Covid-19 shock, price-earnings ratios remain at high levels, particularly in the United States. However, based on indices adjusted for expected growth and the level of interest rates, this trend does not appear to be the result of irrational exuberance like in previous speculative episodes.
Stock market indices at all-time highs in the United States
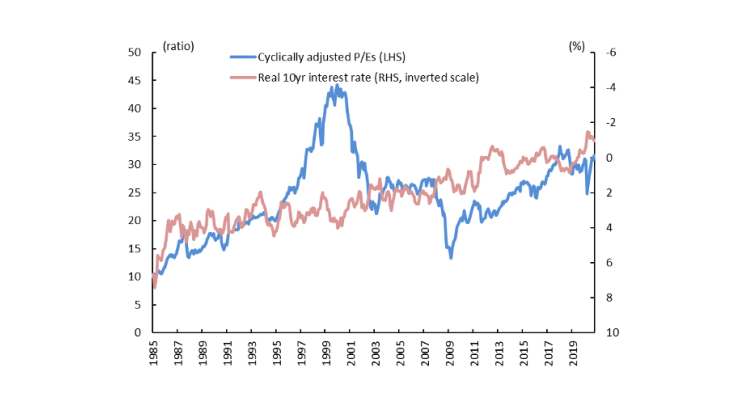
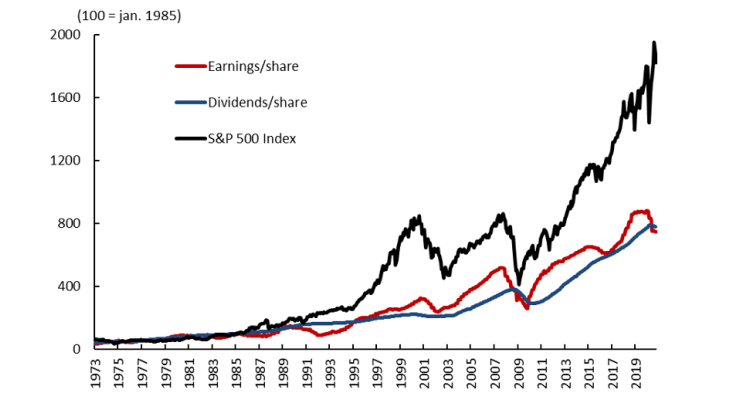
The very strong and almost continuous rise in equity prices between 2009 and the end of 2019 in the United States may have been a sign of excessive optimism in the markets prior to the emergence of Covid-19. The rebound in the indices as of the end of March 2020 (+31% for the S&P 500 between October and March), coupled with a marked fall in corporate earnings (Chart 2), has further fuelled these concerns. Following Campbell and Shiller (1988), if we adjust the price/earnings ratio (P/E) for the business cycle by stripping out inflation and smoothing earnings per share over 10 years, valuations appear to be historically high: the cyclically-adjusted P/E now exceeds its 2007 level and stood, in October 2020, at a level close to that of end-2019 (Chart 1).
Most recent value: October 2020
Correspondence between the equity market and the bond market
While P/Es are high in the United States, they have to be compared with the different macroeconomic variables on which they depend, in particular real interest rates, which remain historically low. Based on the valuation model of Gordon-Shapiro (1956) and the work of Antonio Fatas (2018), we can simply model the price of a stock as the net present value of earnings adjusted for expected growth and discounted for the yield demanded by investors. The yield can itself be broken down into a term premium, equivalent to the risk-free rate on the bond market, and a risk premium. The part of the yield corresponding to the risk-free rate is intended to compensate the investor for the time between purchasing the stock and the payment of dividends, while the part corresponding to the risk premium is intended to compensate the investor for taking a risk in terms of the uncertainty affecting the amount of dividends paid.
Thus, theoretically, three factors, which may be at play together, can push stock market indices upwards. Either risk-free rates are low, or investors have a high risk tolerance and accept a low risk premium, or lastly investors expect rapid earnings growth. These latter two factors depend mainly on agents' expectations and therefore capture their optimism or pessimism about macroeconomic conditions.
To measure these expectations, we can easily rearrange the Gordon-Shapiro (GS) equation to construct our Relative Return Indicator (RRI) by comparing two real returns, i.e. equity and bond market returns. The RRI is thus equal to the difference between the observable variables (the real risk-free rate and the observed earnings yield, i.e. the inverse of the P/E) which is itself equivalent, according to the GS formula, to the difference between the non-observable variables (expected growth and the risk premium). Hence, the RRI will be high if expected growth is high and the risk premium is low, thus corresponding to the stylised facts that are characteristic of speculative bubbles (Shiller, 2015). In such a case, stock markets will be perceived as expensive compared to the bond market.
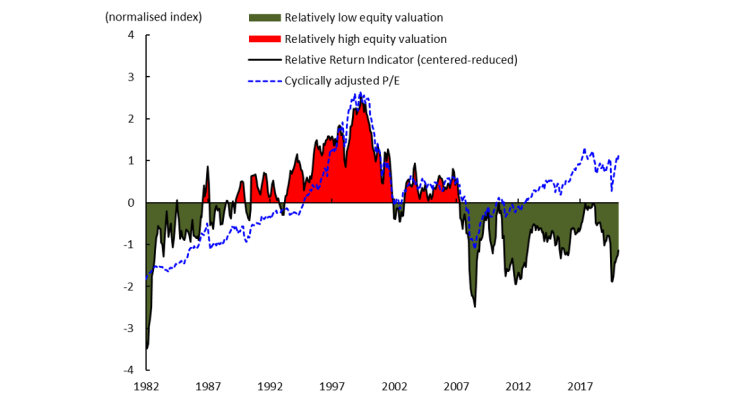
Sources: Datastream, Robert Shiller website Fed Saint Louis & Philadelphia. Author’s calculations Most recent value: October 2020 Note: RRI = risk-free rate - P/E. According to GS, RRI = expected growth rate - risk premium. The indicator is normalised.
Chart 3 shows changes in US RRI over time, with the green and red areas indicating whether the indicator is below/above its long-term average. We note that the RRI accurately captures the periods of stock market exuberance in 1987 and 1990-2000, and even in 2007 (red zones), episodes also marked by an increase in P/Es. As real interest rates were relatively high at the time, high stock prices could only be justified by excessive optimism about growth or by perceptions that risk was abnormally low. In contrast, for the recent period, while the cyclically adjusted P/E clearly suggests an overvaluation, the RRI is more neutral. Thus, whereas the stock market displayed an independent upward trend during the "Internet bubble" of the late 1990s, today the high stock market valuations are in line with those observable on the bond market. In other words, unlike in the 1990s, investors today do not appear to be overly optimistic about growth or insensitive to risk as they are not overvaluing risky assets - equities - relative to fixed income securities - sovereign bonds. However, this assessment is only relative, and does not, in essence, assume an efficient valuation of risk-free bonds, which would require estimating a structural model.
The observation also applies to the French stock market. Chart 4 shows that since the great financial crisis, the rise in stock prices does not seem to stem from a form of "irrational exuberance", especially since the March 2020 rebound was less marked in France than in the United States. It should be noted, however, that the difference in the pace of the recovery at the end of the first half of 2020 is due in particular to an index composition effect. Technology stocks account for more of the US index than consumer goods stocks (29% of the index's capitalisation for technology and 20% for consumer durables), while the opposite is true for the French index (7% for technology and 12% for consumer durables). In other words, given that lockdown policies have benefited digital companies more than the consumer goods sectors, it is not surprising to observe a divergence between the stock market dynamics of the two countries.
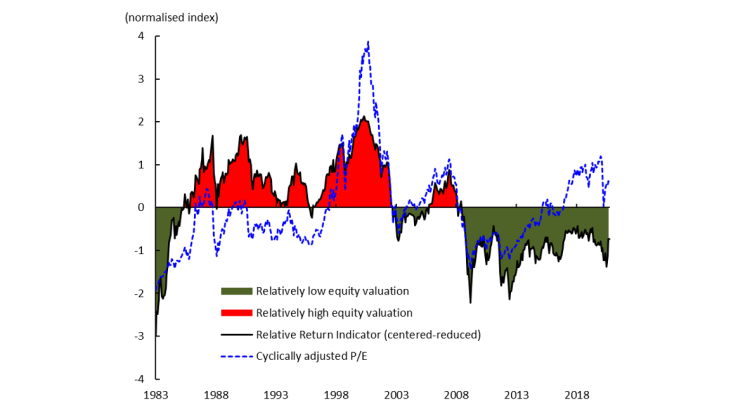
Sources: Datastream, IMF. Author’s calculations. Most recent value: October 2020 Note: RRI = risk-free rate - P/E. According to GS, RRI = expected growth rate - risk premium. The indicator is normalised.
Decomposition of the RRI and recent deterioration
Using the IMF's long-term (5-year) growth forecast for the United States, we can refine our analysis by decomposing the RRI. Indeed, given that the RRI is theoretically equal to the difference between the expected growth rate and the risk premium in the stock market, subtracting the RRI from a proxy of expected growth is equivalent to estimating the risk premium of the US market.
The latter (Chart 5) fell to a very low level at the end of the 1990s (0.9% in June 1999), in conjunction with extremely high observed P/Es and relatively high real interest rates (4%). Consequently, over this period, equity prices could not easily be explained by bond prices. This was therefore a clear case of stock market exuberance, either because markets overestimated GDP growth (compared to IMF forecasts) or because they underestimated their portfolio risk. In recent years, rising stock prices and falling interest rates have gone hand in hand with a relatively stable risk premium of 6%, which makes them different from the "irrational exuberance" of previous speculative episodes.
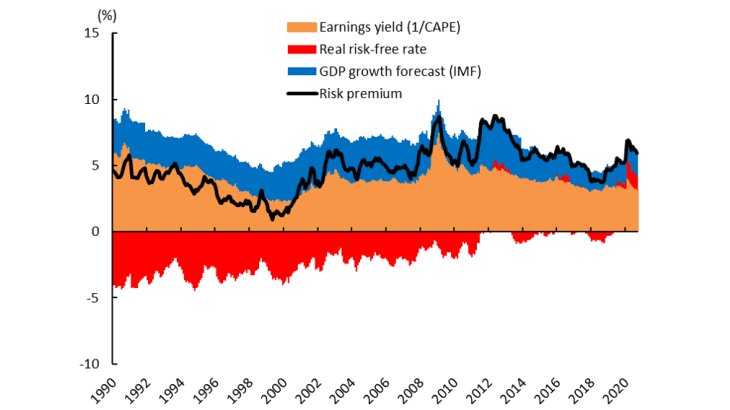
Sources: Datastream, Robert Shiller website, Fed Saint Louis & Philadelphia, IMF. Author’s calculations. Most recent value: October 2020 Note: According to GS, risk premium = expected growth rate - (risk-free rate - P/E).
Updated on the 25th of July 2024