Eco Notepad

The public health crisis: a complementary approach to firms' activity

Published on 20 April 2021
Authors : Benjamin Bureau, Anne Duquerroy, Mathias Lé, Frédéric Vinas, Julien Giorgi, Suzanne Scott

Post n°211. Since the start of the public health crisis, the Banque de France and INSEE have compiled a monthly estimate of the loss of activity in each sector, notably via their monthly economic surveys and their monitoring of high-frequency data. The monthly surveys have proved to be a reliable and almost real-time indicator of the impact of the restrictions, and have on the whole been confirmed by the national quarterly accounts. In parallel, the Banque de France and INSEE have launched a joint project which differs from these surveys but complements them in terms of methodology: using real turnover data for individual firms (measured using VAT returns), they compare ex-post the “activity shock” with a counterfactual of what turnover would have been without the. This makes it possible to carry out an analysis at a more granular level, within individual sectors. This blog post presents the first results of this project, which are consistent with our monthly surveys. They will be supplemented with an ex-post analysis of firms’ cash and financial positions.

Image Evolution of the aggregate shock to activity over 2020
Chart 1 – Evolution of the aggregate shock to activity over 2020
Source: VAT data (DGFiP) and authors’ calculations.

Between March and December 2020, the public health crisis had a major impact on firms’ activity levels: the average shock to turnover for the period is estimated at over 15% compared with a simulation of what it would have been without the crisis. An analysis of firm-level data shows disparities both in the size of the shock across sectors, with some proving particularly hard-hit, but also in the trajectories/situations of individual firms, with some succeeding in limiting the fall in activity.

The widespread roll-out of public health restrictions in most countries as of March 2020 triggered a drop in global economic activity. Measured at the macroeconomic level, the size of the shock is clear. However, trends described using macroeconomic approaches can mask significant variations in individual situations: in some cases they can be better or indeed worse than implied by the overall macroeconomic picture.

As firms’ economic and financial positions are, by nature, heterogeneous, we need to look at individual data to estimate the activity loss at the level of each firm, in order to better understand how the shocks are spread across businesses, including within sectors. In France’s case, these individual data are the VAT returns filed by firms to the tax authorities. They show how each firm’s turnover evolved over the course of 2020.

This firm-level analysis complements the sectoral overviews provided by the Banque de France and INSEE’s business surveysthe quarterly national accounts or the recent innovative use of real-time activity indicators (see INSEE, 2020).

Monthly measurement of the activity shock at firm level

Using VAT returns, we constructed monthly turnover series for some 850,000 non-financial corporations (NFCs), accounting for over 75% of total NFC value added. The activity shock suffered by each firm is quantified by comparing the observed level of turnover with the level that would have been expected in the absence of a crisis, referred to as the counterfactual. The latter is estimated first by sector (excluding energy and finance – code A17 in the French classification of economic activities) and then by firm size (very small enterprises, small and medium-sized enterprises, intermediate-sized enterprises and large enterprises) within each sector, based on the monthly level of observed activity between 2014 and 2019. Counterfactual activity at the individual firm level is then obtained by breaking down sector-level activity according to each firm’s market share within its sector-size category, taking into account the recent trend in that market share and the seasonal nature of the firm’s activity.

A brutal shock to economic activity that varies significantly across sectors

Chart 1 shows the aggregate shock to firms’ activity. The trajectory obtained corresponds to that identified in the business surveys and national accounts: a marked drop in turnover between March and May 2020 during the first lockdown, of around 27%, then a partial recovery from June to September, followed by a relative stabilisation. The Banque de France and INSEE’s business surveys estimate a similar loss of activity for the period, and this is confirmed by the national accounts.

Image Cumulative shock to activity between March and December 2020: breakdown by secto
Chart 2 – Cumulative shock to activity between March and December 2020: breakdown by sector
Source: VAT data (DGFiP). Authors' calculations.

Note: The shock to activity is the difference between observed turnover and the simulated counterfactual level of turnover. The shock is shown as a cumulative loss of activity for the period March-December (red line), and then broken down over three different periods (bar chart): March-May, June-September and October-December.

As well as differing in intensity, the first and second lockdowns also differed in terms of the number of sectors affected (Chart 2).

- The first lockdown (March-April) was a broadspread shock which affected all sectors, although to differing degrees. The worst affected sectors were accommodation and food services, and the manufacture of transport equipment, while the least affected was information and communication technology (ICT).

- For the second lockdown (October-November), where the restrictions were more localised, the findings are very different. Only a few specific sectors were badly affected, for example accommodation and food services, and personal services (included under “other service activities”), whereas most other sectors saw only a limited decline in activity. This was due to the less strict nature of the measures, and to the fact that businesses had managed to adapt to the new operating conditions in the wake of the first lockdown.

The sector-level shock masks marked variations in individual situations

To appreciate how individual trajectories differed in 2020, we need to look at what would happen in a “normal” year. Even without a major shock, trajectories vary widely across sectors and across firms within sectors. But with the 2020 crisis, these divergences were amplified.

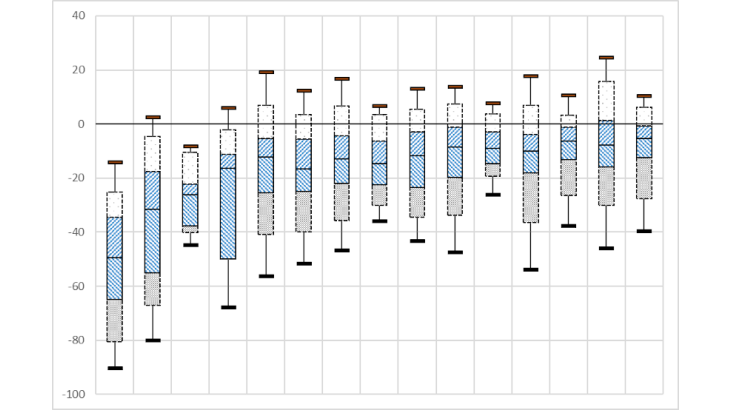
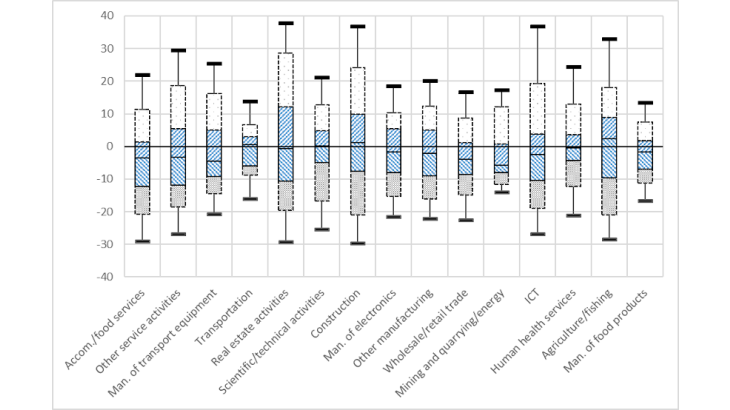
Charts 3a and 3b illustrate these points. The first (3a) shows, by sector of activity, the main quantiles in the distribution of the activity shocks in 2020, which was an exceptional year. The second (3b) shows these same indicators during a “normal” year, in this case 2019. The shocks in 3b are highly dispersed. The median is relatively close to zero, and some firms posted trajectories that were better or worse than might have been expected. Although some sectors appear on the whole to have had better or worse activity levels in 2019 than suggested by the counterfactual, the differences between sectors are not huge.

2020 differs in three respects (Chart 3a). First, the entire distribution is shifted downwards, reflecting the overall drop in activity and a much higher proportion of declines in activity/negative activity shocks. Second, there is a marked difference in trajectories between sectors. Third, the dispersion within each sector is also wider in 2020 than in a normal year.

A slightly stronger sectoral contribution at the height of the crisis

The increased intra-sectoral disparity between activity shocks in 2020 may reflect a higher prevalence of large shocks, or uneven exposures or adaptation to the crisis within sectors. It may also stem from the fact that, in certain sectors, not all firms were subject to the same constraints in 2020: in retail, for example, the authorities’ decision on which shops to close was based on a more refined sectoral breakdown, which took into account the firm’s principal activity.

To capture the nature and extent of the sectoral heterogeneity at a very granular level (across 732 activity codes), the overall variance in individual shocks can be broken down into an inter-sectoral component (reflecting the dispersion between sectors at a granular level) and an intra-sectoral component. At the peak of the crisis (April 2020), the sectoral dimension only explains 20% of the variance in shocks. It plays a much bigger role than during a normal year (less than 5% in any given month in 2019). However, even at this very granular level, it only explains a limited part of the dispersion in activity shocks. The role of the sector is also more marked in those sectors hit by specific administrative measures (e.g. accommodation and food services) than in those sectors only affected by the general measures: for the first type, the share of the variance explained by the sector is six times larger in 2020 than in 2019, whereas for the second type, it is only twice as large.

Understanding the factors that make individual firms within sectors more resilient or vulnerable in the face of the crisis can offer valuable lessons for the future. In particular, the factors that made them more resilient (such as digitalisation, location, reorganisation of working methods) can provide more general lessons on the future direction in which we should steer the economy.

From the point of view of public policies, these findings suggest that, although firms’ sector of activity has played a bigger role than usual, this is not the only criteria that should be taken into account in defining crisis exit policies.
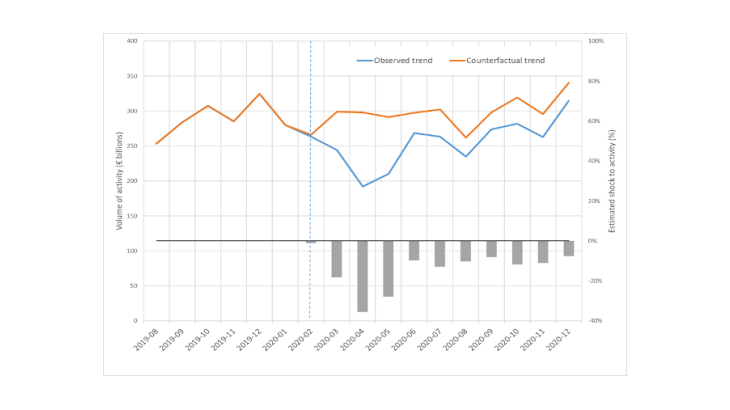
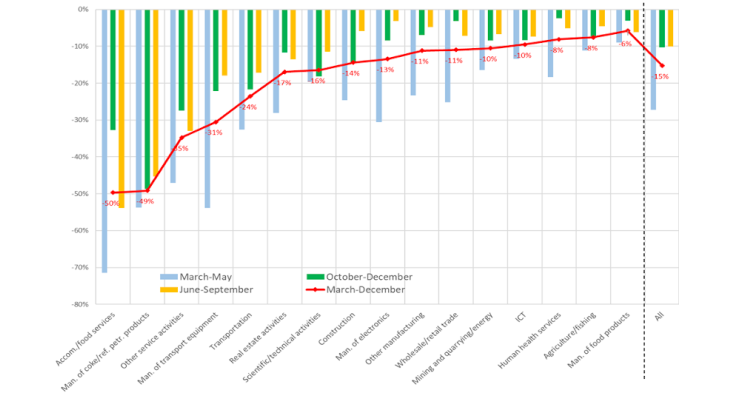
Image Chart 3a: Dispersion of activity shocks in 2020, an exceptional year Source: VAT data (DGFiP). Authors' calculations.
Chart 3a: Dispersion of activity shocks in 2020, an exceptional year
Source: VAT data (DGFiP). Authors' calculations.
Image Chart 3b: Dispersion of activity shocks in 2019, a “normal” year Source: VAT data (DGFiP). Authors' calculations.
Chart 3b: Dispersion of activity shocks in 2019, a “normal” year
Source: VAT data (DGFiP). Authors' calculations.

Key: Each bar corresponds to a sector. The lines in the bars indicate, from bottom to top, the 5th centile, 1st decile, 1st quartile, median, 3rd quartile, 9th decile and 95th centile. The shocks are weighted by the number of employees in the company. In 2020, 5% of employees in the agriculture and fishing sector worked in firms that experienced a drop in activity of over 46%.