Eco Notepad

A post-depreciation view of the non-financial corporations account

Published on 11 April 2018
Authors : Pierre Sicsic

Post n°59. In France in 2016, the gross margin rate of non-financial corporations (NFCs) returned to its early 2000s level, at 32%, while the net margin rate was 15%, compared with 18% in the 2000s. Thus, using aggregates "net" of capital depreciation gives a different picture of the NFCs account. Furthermore, the NFCs' net saving rate would be close to zero, and their stock of fixed capital could only increase through external financing.

Image gross and net margin rates of French NFCs
Chart 1: gross and net margin rates of French NFCs
Source: Insee, table 7.101 – non-financial corporations account (S11).

Capital deterioration and net operating surplus

Consumption of fixed capital (CFC) corresponds to the deterioration of the capital required for production. The concept of CFC is applied to gross value added to calculate net value added, which finances the remunerations of factors of production.

It took some time for managers to grasp the notion of capital depreciation. In "The Visible Hand: The Managerial Revolution in American Business" (1977, page 279), Chandler explains that the question of depreciation was not considered in accounting until fairly late: "...until well into the twentieth century, nearly all large industrial firms continued to use replacement accounting, which their managers had borrowed from the railroads. As on the railroads, they defined profits as the difference between earnings and expenses, and the latter included repairs and renewal."

The concept of depreciation is now well understood, but the measurement of CFC in national accounts is complex and imperfect. It is based on useful life and declining investment effectiveness assumptions, rather than on repeated statistical observations. Due to this measurement problem, national account aggregates (most notably GDP) are usually expressed in gross terms. The approach used in this article, however, puts this difficulty aside and considers the extent to which the changes in the position of French NFCs differs when "net" aggregates are used.

Chart 2 presents the ratio of CFC to gross value added in the major European countries and the United States. Due to the availability of series, this international comparison is based on the economy as a whole, whereas Chart 1 deals with French NFCs only. We can see that in general the ratio trends upwards, although since 2009 the increase has been smaller in the United States than in the major European countries. The reasons behind this divergence have not been identified, although the possibility that it is at least in part due to differences in CFC estimation techniques cannot be ruled out.
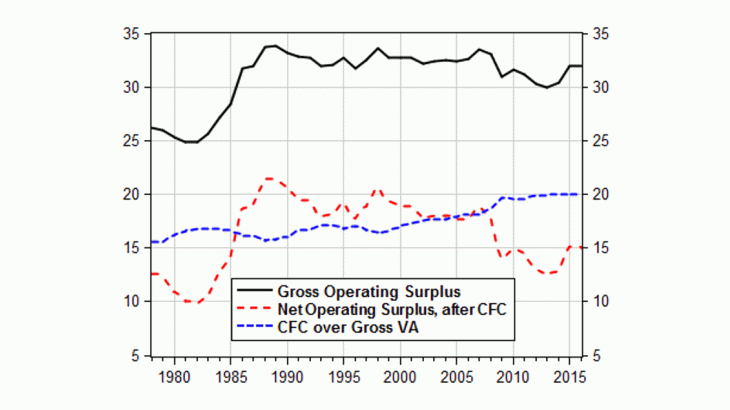
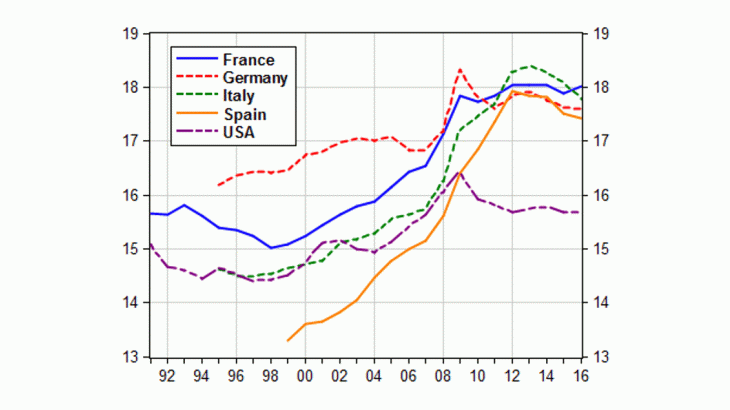
Image ratio of consumption of fixed capital to GDP (For the economy as a whole)
Chart 2: ratio of consumption of fixed capital to GDP (For the economy as a whole)
Source: Eurostat (naida_10_gdp) and Bureau of Economic Analysis (table 1.7.5).

When the analysis is restricted to French non-financial corporations, consumption of fixed capital accounts for an increasing proportion of gross value added, rising to 20% since 2009, from 16% during the period from 1980 to the end of the 1990s (see Chart 1). This four-point increase has a negative impact on business profitability. The ratio of net operating surplus to net value added, or the net margin rate of NFCs, therefore declined from around 18% at the beginning of the 2000s to 15% in 2016, falling back to its 1985 level.

Working down through the non-financial corporations account to savings

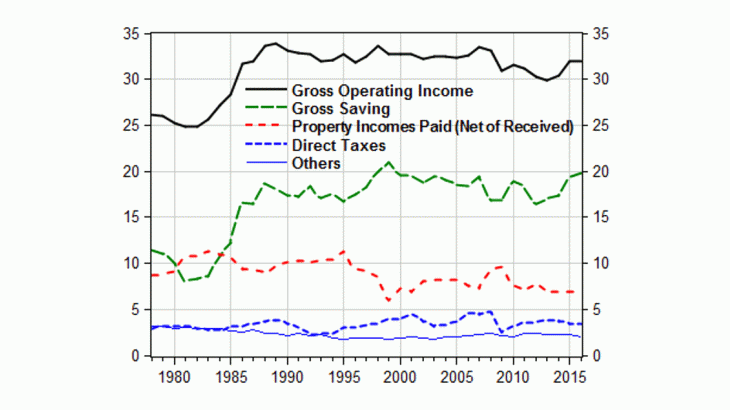
In the national accounts' enterprises account, (i) property income (interest and dividends) then (ii) corporate income tax and (iii) various other adjustments are set out below the operating surplus line (equal to value added less staff costs and taxes on production) to arrive at gross saving.

The difference between the margin rate and the saving rate as a ratio of gross value added (VA) is the sum of these three components, all of which are negative (for presentation purposes in Chart 3, their sign is reversed). The downward trend in property income is related to the decrease in interest rates. The proportion of corporate income tax has remained stable.

Image  breakdown of French NFCs' gross operating surplus (% of gross VA)
Chart 3: breakdown of French NFCs' gross operating surplus (% of gross VA)
Source: Insee, table 7.101 – non-financial corporations account (S11).

Despite an upturn, net saving was zero in 2016

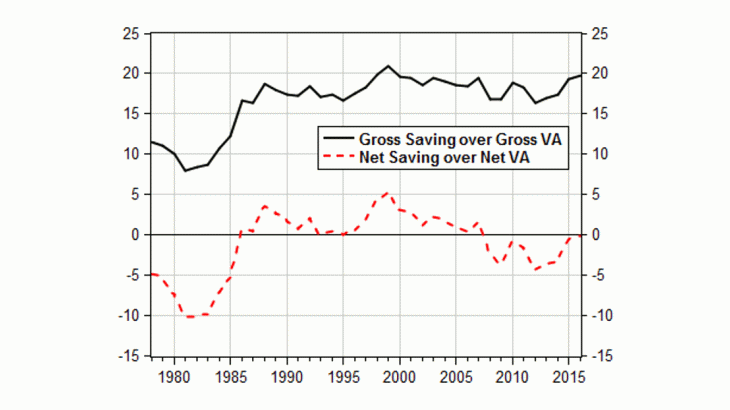
NFCs' net saving (equal to gross saving less CFC) was zero in 2016, after several years of being negative (see Chart 4). This means that, subject again to the problems associated with measuring CFC, companies have to turn to external financing (debt and shares) to increase their stock of fixed capital.

Overall, trends in the profitability of French non-financial corporations over the past fifteen years are less favourable when capital depreciation is taken into account, although this does not call into question its recent recovery. However, this finding should be treated with caution. First, this divergence in gross and net profitability trends is not unique to France, as our major European neighbours' consumption of fixed capital (as a percentage of value added) has also increased in the same proportions. Second, and most importantly, significant uncertainties remain as to the measurement of consumption of fixed capital, as was stressed earlier, which explains why national accountants in all countries continue to use gross aggregates.

Image gross and net saving rates of French NFCs
Chart 4: gross and net saving rates of French NFCs
Source: Insee, table 7.101 – non-financial corporations account (S11).