- Home
- Publications et statistiques
- Publications
- Measuring the value of foreign direct in...
Post No.404. Whereas the market value of listed companies can be observed directly using share prices, the vast majority of foreign direct investment (FDI) is in unlisted companies and can only be estimated based on book value. Valuing FDI at market prices reduces France’s net external borrowing position by EUR 200 billion.
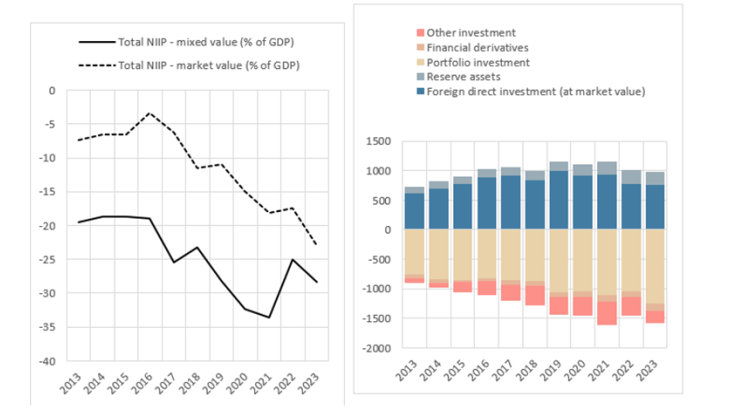
France’s net international investment position (NIIP), or the value of the net assets or liabilities of its residents vis-à-vis the rest of the world, is negative and has tended to deteriorate over the past decade. However, the foreign direct investment (FDI) component of its NIIP is significantly positive and has increased over time (mixed value of EUR 564 billion in 2023, or 28% of GDP; see Chart 1). France also has one of the world’ highest levels of net FDI earnings (Nayman and Vicard, 2018). This blog post looks at how to value FDI, as it has a considerable impact on a country’s NIIP.
Chart 1: France’s net international investment position (NIIP) and its components in the financial account

Note: In mixed value, the unlisted portion of outstanding FDI is measured at book value and the listed portion at market value. The right-hand panel shows the breakdown of NIIP by investment type at market value
The challenge of valuing foreign direct investment
An FDI is an investment made in a given country by a company based in a different country. According to the Balance of Payments Manual, for an investment to qualify as an FDI, the investor must hold at least 10% of the voting rights or ordinary shares of the foreign enterprise, giving them significant influence over its strategic decisions. Below this threshold, holdings are classified as portfolio investments.
Calculating the value of an FDI is not easy. For listed companies, the procedure is fairly straightforward as the price can be observed directly on financial markets. However, a large share of companies receiving FDI are not actually listed on a stock market: unlisted companies account for 96% of France’s FDI assets and 77% of its FDI liabilities.
In line with international IMF and OECD standards, many countries, including France, rely on the “own funds at book value” method to value their FDI positions. However, this method has its drawbacks: it often underestimates a company’s “true” value as it fails to factor in non-physical items such as growth prospects or certain intangible assets (quality of the workforce or the particularly well-suited location of a production unit). Hence when a company goes public, it is often priced at well above book value. On average, the transaction value of a company – i.e. its market value – is double its book value.
The market capitalisation ratio method
To provide a more accurate estimate of market value, our study (Genre, Guette-Khiter and Robin (2024) uses a method recommended by international organisations: the market capitalisation ratio method. Based on the principle that equivalent assets should have the same price, allowing for liquidity differences, the market value of unlisted FDI can be estimated using stock market indices (see Nivat and Topiol, 2010). However, instead of using indices, which tend to overweight large caps, we improve on this method by relying on the individual prices of shares issued by each company, which are widely available.
Using the European Central Bank’s Centralised Securities Database (CSDB), along with accounting data from private data providers (Bloomberg and Refinitiv), we compile a dataset of some 70,000 observations covering 241 countries or regions (such as the euro area) and 9 sectors of activity, for the period 2013 to 2023.
For each unlisted company, we identify listed companies operating in the same sector and country, and calculate a market capitalisation ratio for each of those, corresponding to their market value divided by their book value. To obtain the market value of unlisted firms, we then multiply their book value by the median capitalisation ratio per sector/country.
A wide variation in capitalisation ratios depending on sector and country
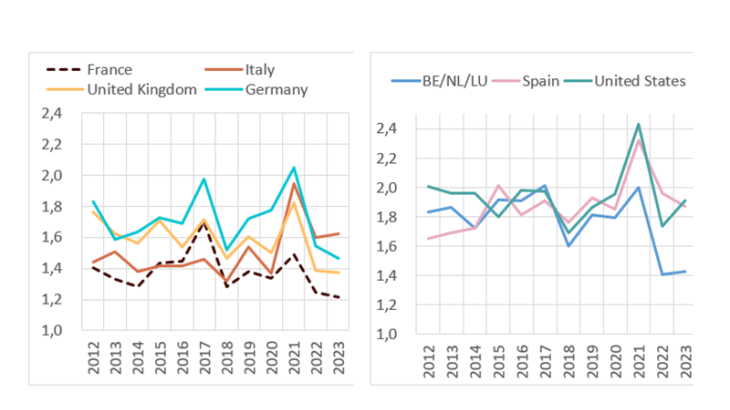
The ratios vary widely from country to country. Among France’s main FDI partners, the Netherlands, Spain and the United States had the three highest ratios in 2023 (see Chart 2). This suggests that high ratios may be linked to more active stock markets or to their sectoral composition. Debt levels may also matter significantly. On average, French companies have higher debt levels than their European or US peers, which can weigh on their net profitability and increase risk perceptions, both of which can lower their market valuation.
Chart 2: Market capitalisation ratios (unweighted average of median ratios; 2012-23)

Note: The countries shown are France’s main FDI partners. Multiplying unlisted companies’ book value by these ratios gives their market valu
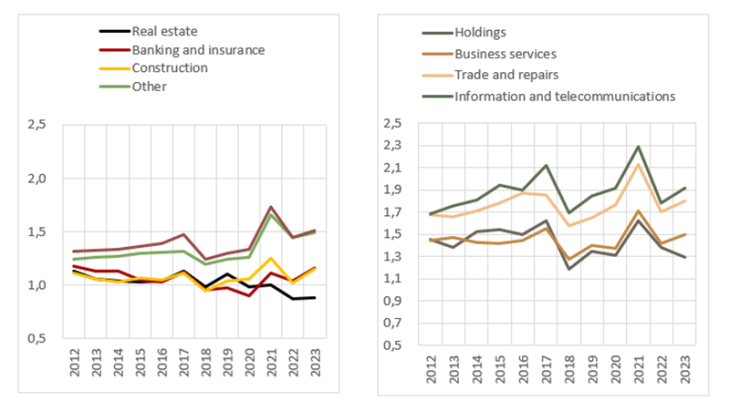
Similarly, capitalisation ratios differ according to business sector. For example, financial sector ratios are often lower than 1 due to the large share of own funds in financial intermediaries’ balance sheets (see Chart 3). Information technology firms, on the other hand, tend to have high ratios as they have significant intangible assets and are seen by markets as having stronger growth prospects linked to innovation.
Chart 3: Market capitalisation ratios by business sector (average of median ratios; 2012-23)

It is important to stress, however, that market capitalisation ratios can be strongly impacted by financial bubbles and asset price volatility, as share prices are much more volatile than book values.
France’s NIIP is less negative when calculated at market value
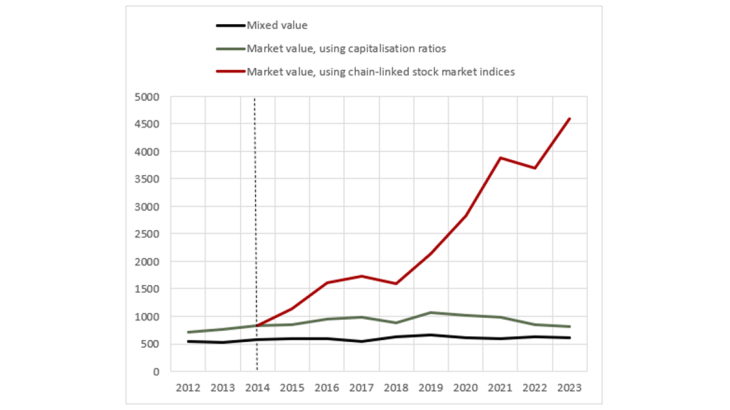
The few countries that report FDI data at market value have traditionally valued FDI stocks at time t then updated this value based on stock market indices. This index-linked method tends to overestimate FDI stocks, and can even cause them to skyrocket over time as it decorrelates their valuation from the book value used to calculate ratios in the base year. By applying the corresponding capitalisation ratio to each period considered, we obtain FDI estimates that are more consistent with their book value at that time (see Chart 4). This gives an NIIP that is some EUR 200 billion less negative measured at market value (see Chart 1).
Chart 4: France’s net FDI position (EUR billions)

Note: For reasons of CSDB data availability, the valuation method using market prices only starts in 2014.
However, the method poses a number of challenges. The first is which stock market to use as a reference when calculating capitalisation ratios. When valuing a subsidiary of a large foreign group, should local stock market prices be used as a reference, or the valuation of the group, which is often listed on a different market? In our study, we show that the effect of the parent company’s stock price should probably be taken into account, and we choose to assume that the local market has as much influence as the parent company’s market.
Another challenge is communication: the market capitalisation method is more effective when it relies on a broad dataset. It produces less representative results for highly granular geographical and sectoral breakdowns. The United States and Canada are among the few countries that regularly provide FDI estimates at both market and book value. Clear communication is needed when providing multiple measures of the same concept, to ensure users properly understand the data.
Download the full publication
Updated on the 27th of May 2025