- Home
- Publications et statistiques
- Publications
- Macroeconomic projections – March 2023
In order to contribute to the national and European economic debate, the Banque de France periodically publishes macroeconomic forecasts for France, constructed as part of the Eurosystem projection exercise and covering the current and two forthcoming years. Each publication comprises a summary of the projections. Some also include an in-depth analysis of the results, along with focus articles on topics of interest.
Introduction
• Since our December forecasts, energy prices have eased more than expected as the mild winter, energy saving efforts and European measures have helped to avert an energy supply crisis. As a result, for 2023, we have revised inflation downwards and growth upwards in our March projections. At the 2024-25 horizon, the projections are little-changed. These projections, which were finalised at the start of March, are subject to increased uncertainty due to the financial market tensions that have emerged since 10 March.
• In 2022, commodity and energy price pressures led to high inflation, with the annual average rate reaching 5.9% and the year-on-year rate even reaching 7.0% in the final quarter of the year. In 2023, French inflation should start to subside: price pressures on commodities, including on agricultural commodities, eased significantly in the first months of the year and this trend should continue. Against this backdrop, headline HICP (Harmonised Index of Consumer Prices) inflation is projected to fall back markedly, although with some surprises still possible in the month-on-month readings. Year-on-year, inflation should fall to 3.8% at the end of 2023. The less volatile component of inflation, HICP excluding energy and food, is expected to fall at a lag, and to a lesser extent, reaching 3.8% at the end of 2023 compared with 4.2% at the end of 2022.
• In 2024 and 2025, inflation should continue to fall markedly, reflecting the gradual impact of monetary policy tightening which has helped to anchor economic agents’ inflation expectations. It should come back towards the European Central Bank’s (ECB’s) 2% target.
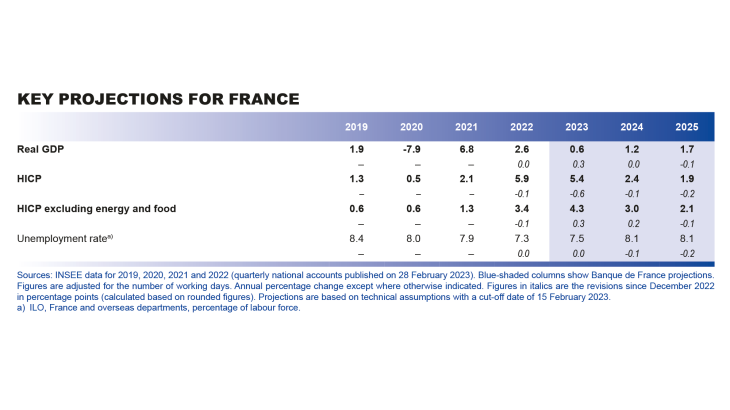
• The external tax shock is continuing to weigh on French households and businesses, but it is decreasing in size more rapidly than we previously predicted. After the marked slowdown in activity at the end of 2022, French economic growth should remain slightly positive at first, at a quarterly rate of 0.1%. It should gradually pick up pace over the end of the year, and GDP growth is projected to be 0.6% in 2023 in annual average terms. Once the external tax shock has passed its peak, the recovery is expected to strengthen, with quarterly GDP growth of around 0.4%, and annual average growth of 1.2% in 2024 and 1.7% in 2025.
• As usual, the employment cycle should lag the economy. Employment growth remained robust in 2022, but we now expect a slight, delayed negative impact from the slowdown in activity as well as from the recovery in productivity gains, which are currently well below trend. This productivity recovery is nonetheless uncertain as employment has regularly surprised on the upside these past three years.
• Over the three years of the projection horizon, the French economy should confirm some resilience in terms of employment, household purchasing power and corporate margins. However, there is a counterpart to this related to the role played by government finances, which will weigh durably on the government debt-to-GDP ratio.
Projections macroéconomiques France 2023-2025 (mars 2023) | Banque de France
Economic activity should grow at a limited rate in 2023 before recovering in 2024 and 2025
These projections incorporate the detailed results of the fourth quarter 2022 national accounts published by INSEE on 28 February 2023, and the short-term economic data from the Banque de France’s first quarter business surveys. They are also based on Eurosystem technical assumptions, for which the cut-off date is 15 February 2023.
Economic growth came out at 2.6% in annual average terms in 2022, but there was a clear change of pace over the course of the year: activity was resilient in the first half, supported by the lifting of the last of the public health restrictions, and then slowed markedly in the second half due to the external tax shock caused by Russia’s war against Ukraine.
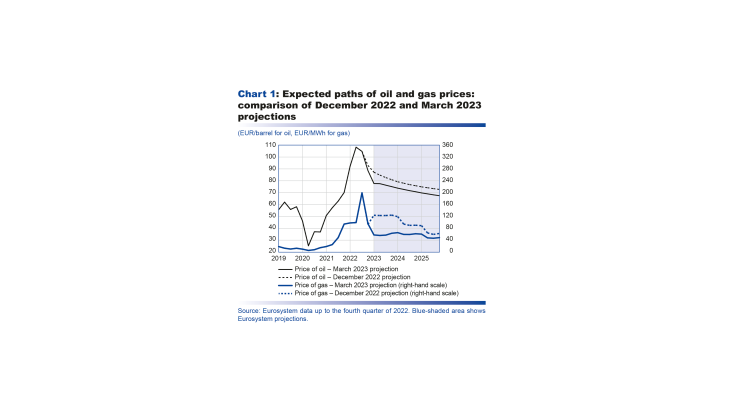
In 2023, activity should prove more resilient than anticipated in our last projections in December. According to Banque de France business surveys, activity should hold up overall in the first quarter of 2023, growing by 0.1%, whereas in December our forecast was for a slight contraction over the period. In addition, our assumptions based on international futures prices, which are factoring in a more moderate outlook for energy prices (see Chart 1), have led us to revise our inflation forecasts down. This, combined with the reduced uncertainty at the start of 2023 and stronger growth in foreign demand for French goods and services (upward revision of 0.4 percentage point in 2023), means we now expect a better pace of activity than we did in December. That said, the financial environment is expected to offset some of the positive effects of the lower energy prices and uncertainty, and the higher foreign demand. The euro nominal effective exchange rate is now higher in our assumptions. According to financial market expectations, which are currently subject to increased uncertainty, the rises in short-term and sovereign yields should also respectively be 40 and 50 basis points greater in 2023 than incorporated into our December assumptions. Overall, annual average GDP growth is now projected to be 0.6% in 2023, which is 0.3 percentage point higher than our December forecast, and for most of the year the quarterly growth rate should be similar to that seen in the second half of 2022. There is still uncertainty surrounding this forecast, but the probability of a recession is now very small.
In 2023, the external tax shock should therefore continue to take a toll on household purchasing power and corporate margins, especially in annual average terms. This should in turn affect all components of private domestic demand, despite the substantial government support. For households, the pass-through of the shock to overall prices should contribute to the sharp slowdown in real income, which is then projected to weigh on household consumption; for businesses, the shock is expected to raise production costs and cause them to scale back investment and job creations. Given the deterioration in the international environment, external trade is not expected to offset this downturn. However, with the easing of energy prices observed at the end of 2022, which is expected to continue until 2025 according to the markets, the external tax shock is anticipated to decline more rapidly than we expected in our December projection.
Once commodity price and energy supply pressures have passed their peak, there should be a marked return to economic recovery in 2024, with annual average GDP growth forecast at 1.2% and quarterly growth at around 0.4%. As inflation recedes, helped by the tightening of financing conditions, domestic demand should gain momentum.
The expansion should be even stronger in 2025, with average annual growth of 1.7%. This is very slightly below our December projection as the smaller slowdown now predicted for 2023 means that the catch-up to the pre-Covid trend should now be slightly more limited. Quarterly growth is forecast to remain at around 0.4%.
Inflation excluding energy and food should reach a peak slightly later than headline inflation, then subside gradually and converge towards 2% by end-2024 to end-2025
Over our projection horizon, inflationary trends are expected to differ fairly markedly over time and depending on the component. This should allow the economy to adapt gradually to the past shocks, which, according to historical regularities, is the basis for sustainable growth.
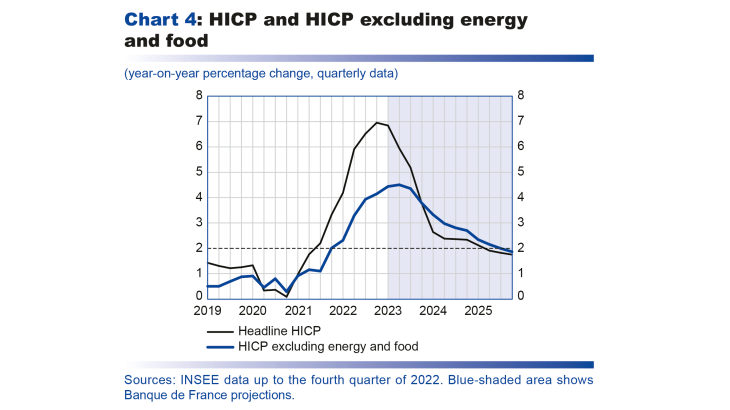
After reaching 7.1% in October and November 2022, inflation as measured by the Harmonised Index of Consumer Prices (HICP) declined to 6.7% year-on-year in December (see Chart 4 infra), amid falling energy prices after the sharp drop in the price of oil. In January and February 2023, however, headline inflation temporarily increased again to 7.0% and 7.3% respectively year-on-year. Core inflation, defined as inflation excluding energy and food, was 4.2% in January and 4.6% in February. The energy component of the index has been supported these past months by the 15% hike in regulated gas and electricity prices in January and February respectively. Food prices, and to a lesser extent manufactured goods prices, have also continued to rise at a high pace, reflecting the strong growth in producer prices observed over the middle of 2022. Lastly, after remaining stable at 3.6% year-on-year from October 2022 to January 2023, services inflation increased slightly to 4.0% in February 2023.
Over the full year 2023, headline inflation is seen falling markedly, essentially in the second half of the year, with the annual average rate coming out at 5.4%, and inflation excluding energy and food at 4.3% (headline inflation and inflation excluding energy and food should both be 3.8% year-on-year in the fourth quarter of 2023). This marked decline in inflation in the second half should mainly be linked to the energy and food components.
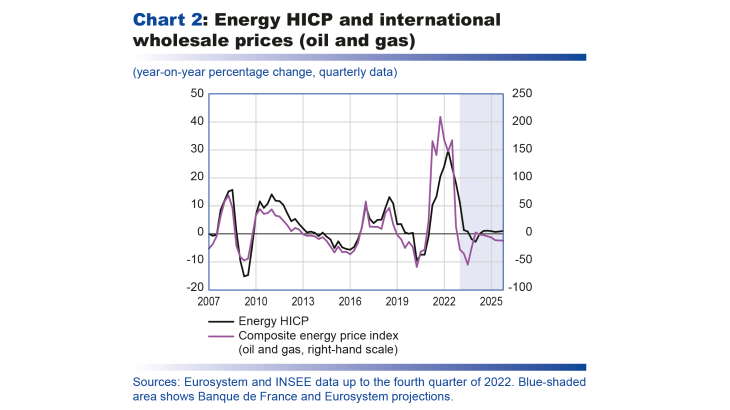
First, energy inflation, while still being buoyed by the rise in regulated gas and electricity prices (in January and February 2023 respectively), should quickly subside in 2023 in the wake of international wholesale prices, which began to fall in the fourth quarter of 2022 (see Chart 2). Prior to 2021, wholesale energy prices, which are essentially determined by the price of oil, were passed through rapidly to consumer prices. Today, the wholesale price of gas is also playing a significant role, and its pass-through to consumer prices is both weaker and slower, notably due to the price shield. The slowdown in wholesale prices should nonetheless continue to feed into energy inflation over the rest of 2023.
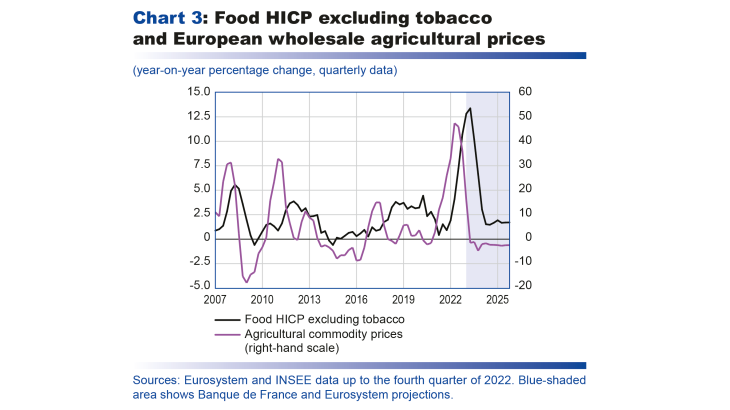
Second, we expect food inflation to prove more persistent in the first half of 2023. It could, in particular, be reinforced by the rise of around 10% in the prices paid by large retailers to suppliers of major food brands, which was announced after the end of talks between manufacturers and large retailers on 1 March. These price negotiations are a French specificity and meant that food inflation was weaker in France in 2022 than in neighbouring euro area countries. However, there should be a catch-up effect in the coming months now that the talks have ended. Once the peak has passed in the second quarter, food inflation should recede amid the expected easing of agricultural input prices (already observed in animal feed, fertilizer, fuel, etc.) and international agricultural commodity prices (see Chart 3).
Regarding the other components of inflation, excluding energy and food, the past shocks should continue to affect non-energy goods prices for some time. Services inflation in particular is expected to prove more persistent over the year, fuelled by wages as a result of the upward revisions to the SMIC (salaire minimum interprofessinnel de croissance or minimum wage) and industry-level negotiated pay rises (see Box 1).
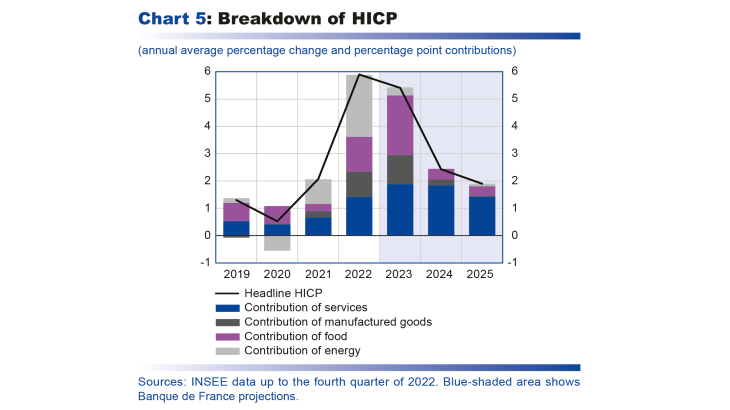
In 2024, with the easing of energy and food commodity prices currently factored in by futures markets, all components of inflation should decline, except for services prices which should still be supported by the lagged rise in wages and rents (see Chart 5). HICP inflation excluding energy and food is projected to fall to 3.0% in annual average terms, and headline inflation should fall more sharply to 2.4%.
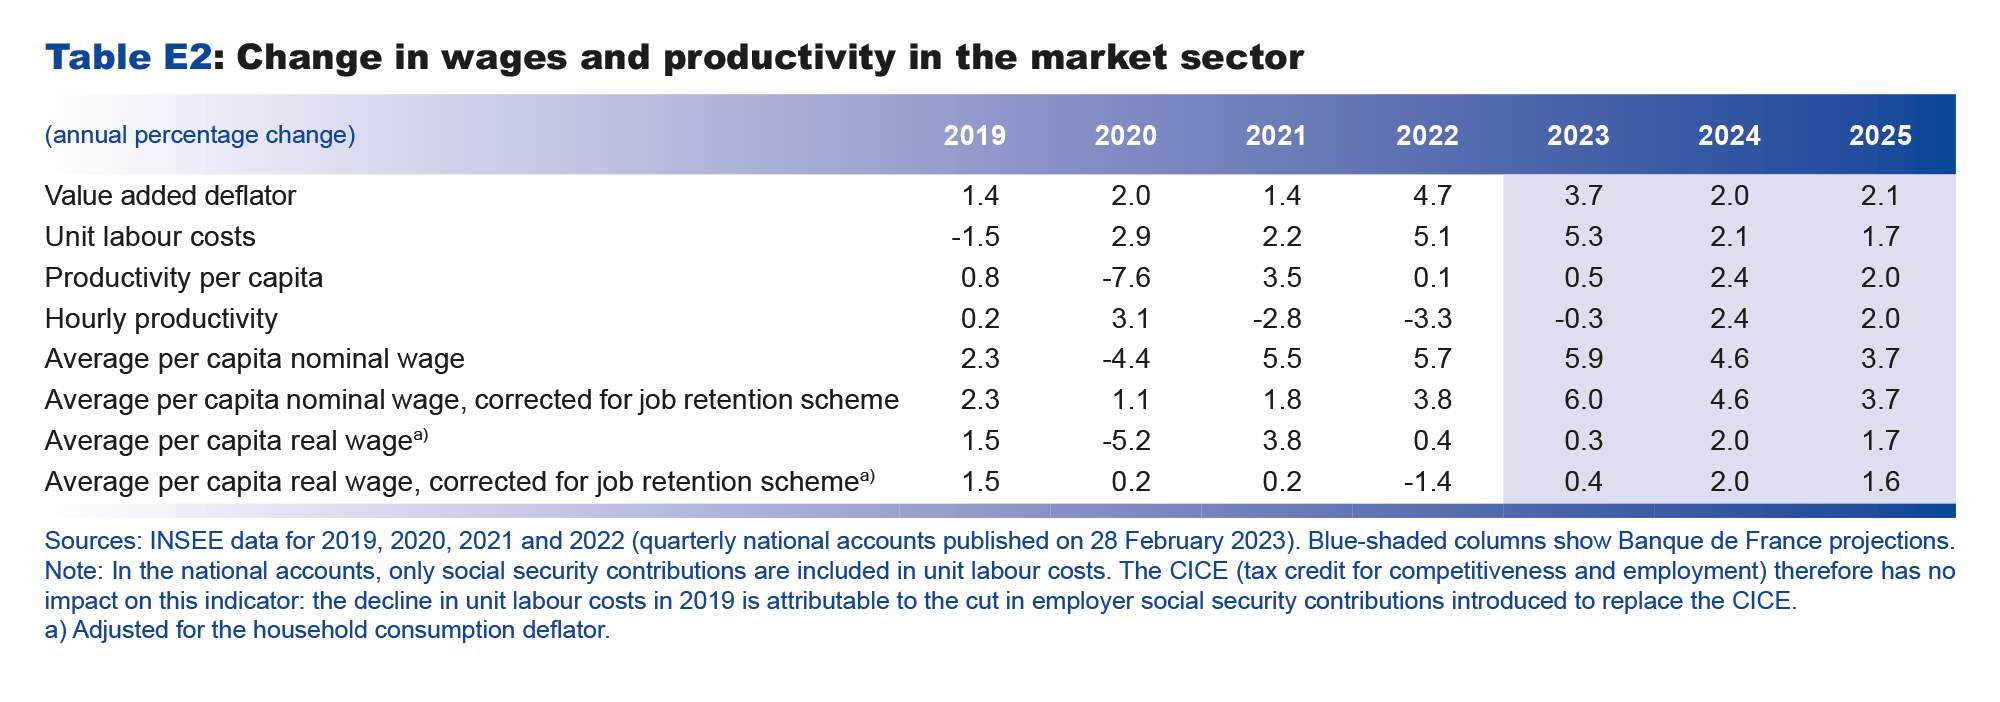
In 2025, the fall in headline inflation is seen continuing and becoming more broadspread, thanks to the progressive normalisation of commodity prices (food and energy commodities) and a further marked drop in core inflation. Services inflation in particular should subside, reflecting smaller nominal wage increases than in previous years (but which should still allow real wages to grow at a robust pace, see table page 8), and should follow a path similar to that seen between the early 2000s and the economic crisis at the end of that decade. Headline inflation is projected to be 1.9% in annual average terms while inflation excluding energy and food should come out at 2.1%.
Over the entire projection horizon, and especially in 2024 and 2025, the monetary policy tightening that has helped to avert an unanchoring of economic agents’ inflation expectations, should contribute to the marked fall in inflation. There should still be substantial fluctuations in relative prices, however, to adapt to past shocks, but headline inflation (as well as core inflation) is predicted to come back towards the ECB’s target of 2%.
Box 1 : Different wage indicators paint a detailed and convergent picture of the wage trend and underpin our services inflation forecast
Evaluating the pass-through of inflation to nominal wages and the wage-price spiral is a key factor in our projections. In addition to our forecasts for the average per capita wage in the national accounts, a number of other wage indicators can be used to assess the trend in wages. In this box, we look at four of these indicators and deduce the implications for our forecast for the average per capita wage and inflation.
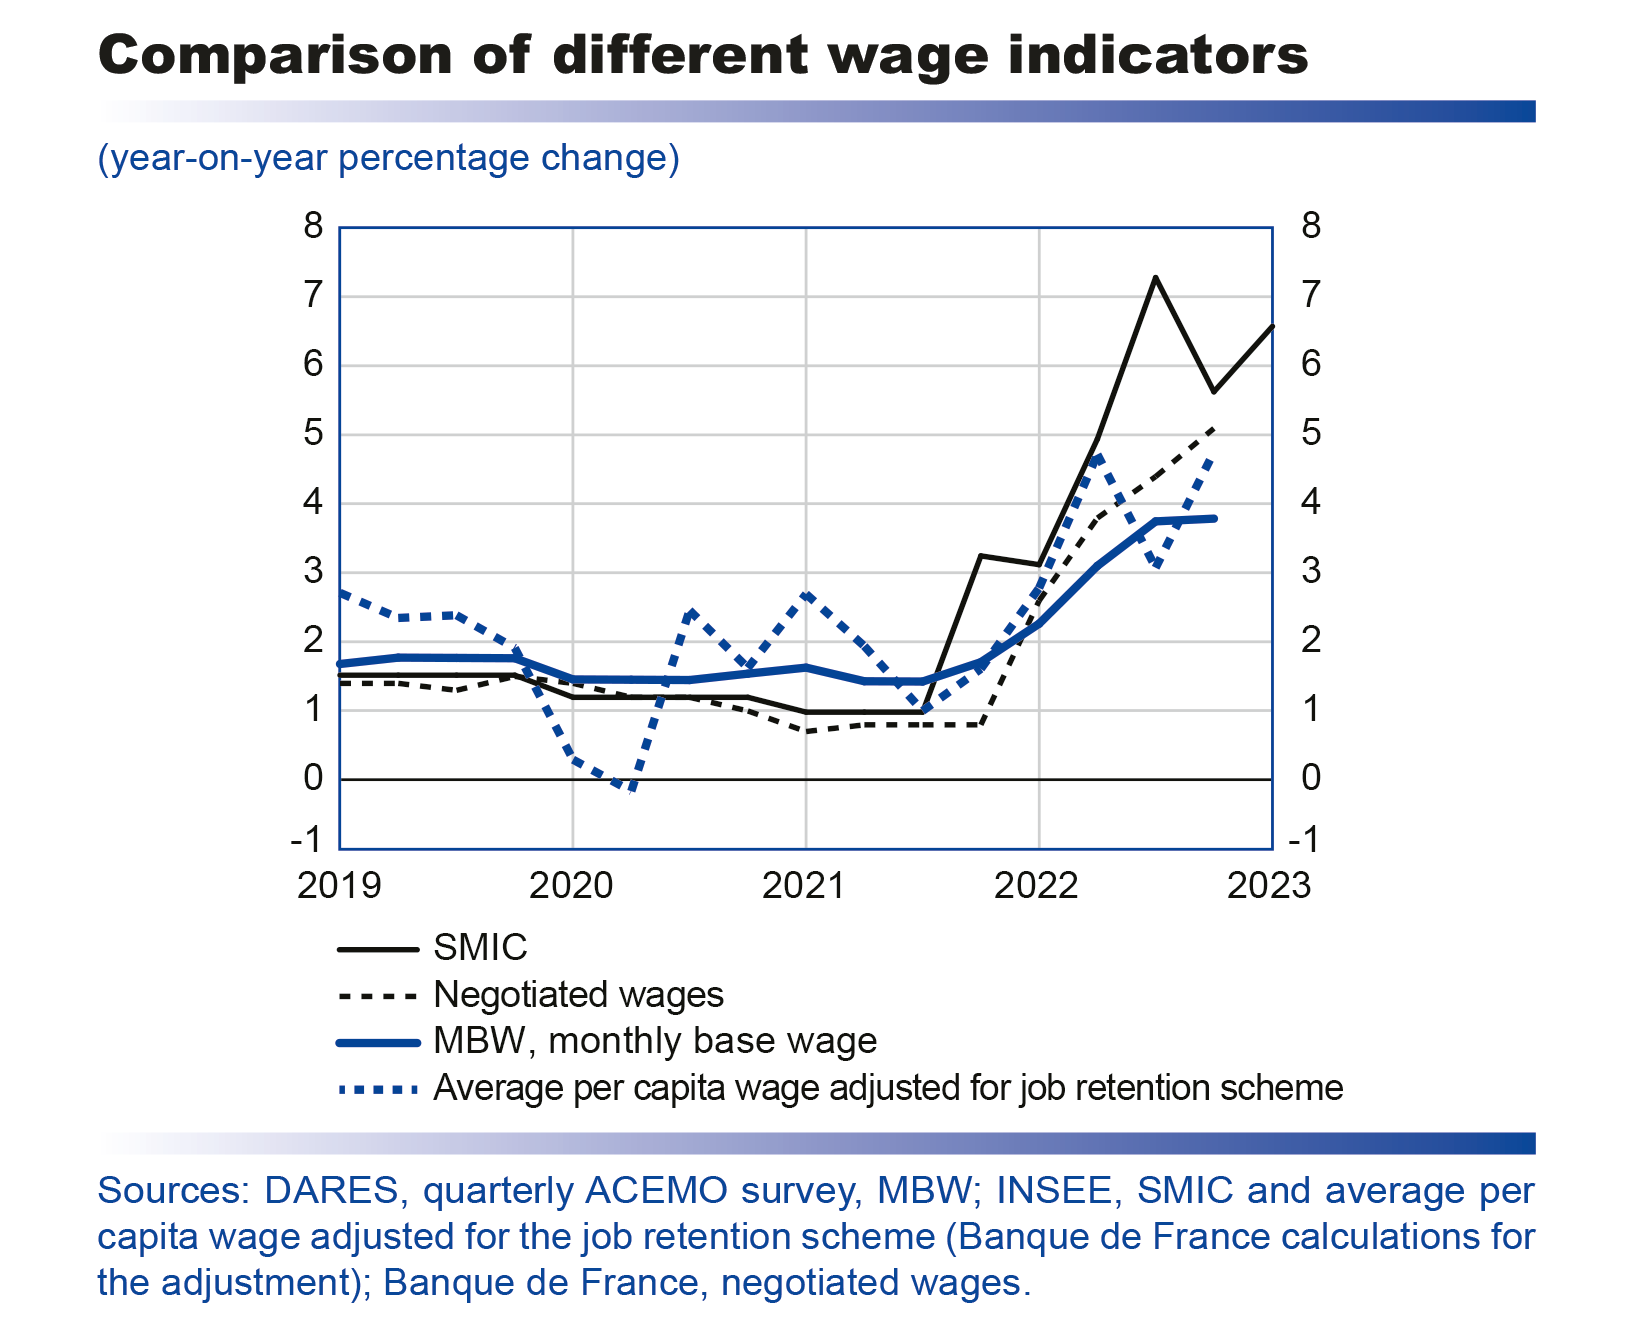
The first wage indicator is the SMIC, which stands for salaire minimum interprofessionnel de croissance and is the hourly wage below which employees cannot be paid. On 1 January each year, the SMIC is revised according to the rise since the previous SMIC revision in the consumer price index (CPI) excluding tobacco for households in the first income quintile, and half of the gain in purchasing power of the hourly base wage for labourers and employees. It is also revised in advance over the course of the year if the change in this CPI index since the previous SMIC revision exceeds 2%. The level of the SMIC is therefore highly dependent on inflation. With the upswing in inflation in 2022, the SMIC has been revised five times since the end of 2021, and in the first quarter of 2023 was 6.6% higher than a year earlier. According to our forecasts, the SMIC should be revised several times in advance between 2023 and 2025 (in addition to the 1 January revisions), but less frequently than in 2021 and 2022. As inflation recedes, the year-on-year change in the SMIC should decrease over the projection horizon, while still remaining high, and should be slightly above 3% in the final quarter of 2025. This is important as changes to the SMIC feed through to the rest of the pay scale via industry-level wage floors – which are notably revised upwards when they fall below the SMIC – and wage bargaining.
The second wage indicator that the Banque de France follows is the index of changes in industry-level negotiated wages, which is compiled by analysing the wage agreements signed in over 350 industries in France. The frequent revisions of the SMIC were gradually passed through to industry-level wage floors in 2022. At the start of 2022, wage agreements provided for increases of close to 3%; however, many industries – especially those where wages are close to the SMIC or which are experiencing hiring difficulties – reopened talks over the year and agreed on pay hikes of around 5% or above, which contributed to the sharp acceleration in negotiated wages at the end of 2022. Year-on-year, the average rise in negotiated wages increased from around 2.5% in the first quarter of 2022 to 5% in the fourth quarter of the year. The first agreements for 2023 indicate that inflation is continuing to feed through to industry-level wage floors, especially in those industries that did not review their agreement in 2022. However the pace of the rises appears to be easing: the first agreements provide for rises of between 4% and 4.5%. Over the rest of the projection horizon, the fall in inflation and lower growth in the SMIC should lead to a slowdown in negotiated wages.
The monthly base wage (MBW) index, which is the third indicator we follow, measures the average change in gross wages excluding bonuses and overtime, based on data from the ACEMO survey conducted by the Ministry of Labour’s research and statistics department, DARES. Base wages are directly affected by revisions to the SMIC and by industry-level wage talks. DARES also provides indexes by socio-professional category (SPC), which makes it possible to see whether the pay rises are homogeneous across workers. The year-on-year rise in the MBW has increased steadily since the start of 2022, from 1.7% in the fourth quarter of 2021 to 3.8% in the fourth quarter of 2022. The changes vary across SPCs: the MBW indexes for intermediate professions and executives have risen less (year-on-year growth of 3.2% and 2.9% respectively) than those for labourers and employees (up 4.6% and 4.3% respectively), probably because the latter categories are more affected by changes in the SMIC and industry-level floors. This heterogeneity is also a welcome indication of the absence of a wage-price spiral, as wage growth appears to vary depending on the economic conditions faced by different employee categories.
In the FR-BDF model used for the macroeconomic projection exercise, we forecast the change in the market sector average per capita wage, as this is the broadest measure of wages and is used to calculate household gross disposable income and hence their purchasing power. Unlike the MBW and negotiated wages, the average per capita wage includes overtime and bonuses – notably the prime de partage de la valeur (PPV – value-sharing bonus) which helped to boost per capita wages in the second half of 2022. The change in the average per capita wage also takes account of individual pay rises, entries/exits from the labour market and employment compositional effects across industries. Over the past year, the year-on-year change in the average per capita wage adjusted for the job retention scheme has increased significantly, from 1.6% in the fourth quarter of 2021 to 4.8% in the fourth quarter of 2022.
The upswing in inflation observed since the start of 2022 has been passed through to the entire pay scale (see chart). It was initially transmitted via the automatic revision of the SMIC, which progressively filtered through to industry-level floors and subsequently affected firm-level wage talks. The adjusted average per capita wage should therefore continue to accelerate over the start of the projection horizon, with year-on-year growth reaching 6.8% in the third quarter of 2023 (6.5% for the unadjusted average per capita wage), fuelled by the revision of the SMIC (+1.8 % in the first quarter of 2023), the pay rises that are currently being negotiated and a continuing historically low unemployment rate.
However, this growth in wages is not expected to trigger a wage-price spiral. Indeed, although the SMIC is rising sharply due to its inflation indexation, the other more aggregated indicators of wages (negotiated wages, MBW and average per capita wage) are seeing more limited growth. In general, unlike in the 1970s, wages are no longer indexed to inflation and only partially track the trend in prices. Also unlike in the 1970s, current monetary policy is helping to anchor inflation expectations and wage talks beyond the short term.
The increases in wages are expected to affect the components of inflation differently, and at a lag compared to the initial energy price shock. Inflation excluding services (food, manufactured goods and energy products) depends more on external factors such as commodity price or supply chain pressures, whereas services HICP (Harmonised Index of Consumer Prices) is the most affected by wages as it comprises labour-intensive activities that are more sensitive to wage trends. As commodity price and supply chain pressures fade over the coming quarters, inflationary pressures on the non-service components of the HICP should ease. All other things being equal, this should help to reduce headline inflation. This should in turn help to lower the mechanical rises in the SMIC, contributing to a slowdown in industry-level negotiated wages.
Overall, the easing of inflation is expected to feed through to firm-level wage bargaining and to the trajectory of the average per capita wage. After peaking in the third quarter of 2023, the year-on-year rise in the average per capita wage should gradually diminish, coming back to just over 3% at the end of 2025. This should feed through to the services HICP, which is expected to be the last component to see its inflation rate decline over the projection horizon, supporting the fall in the more important indicator of inflation – inflation excluding energy and food.
The external tax shock should continue to weigh on household purchasing power but to a more moderate extent
In 2022, the pressures on energy and other imported commodity prices caused by the war in Ukraine acted as an external tax shock to the French economy. The resulting deterioration in terms of trade cost the economy an extra 1.4% of GDP in 2022 compared with 2021, and led to a surge in inflation that translated into a real income shock for both households and businesses. This terms of trade shock should subside in 2023 as pressures on import prices fade with the easing of energy prices, and is expected to represent an additional economic cost of around 0.5% of GDP compared to 2021 when conditions were more normal. It should then remain limited in 2024 and 2025. The reduction in the shock should be faster than anticipated in our December forecasts and it should thus weigh more moderately on households and businesses.
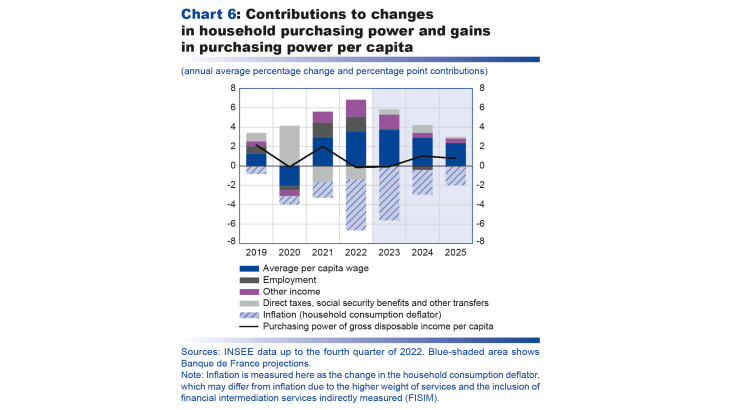
After rising sharply by 2.0% in 2021, real household disposable income has only been slightly impacted by the inflation shock. In average terms, purchasing power per capita was almost stable in 2022, inching down just 0.1% (see Chart 6). This is attributable to a number of factors. First, the inflation-indexation of the SMIC has meant it has been revised upwards five times since the end of 2021, and was 6.6% higher than a year earlier in the first quarter of 2023. Second, these revisions have been passed through to industry-level wage floors and all wage negotiations. Consequently, the average per capita wage (adjusted for the job retention scheme) grew at a robust annual average rate of 3.8% in 2022 (see Box 1 for a comparison of different wage indicators). The strong employment growth in 2022 (689,000 net new jobs in annual average terms) also helped to push up the total wage bill (see Chart 9 infra) as well as purchasing power. Finally, the fiscal support for household purchasing power has also helped to cushion the impact of the inflationary shock. Some government spending is supporting purchasing power via social benefits and transfers (energy cheque, indexation of pensions, cut in housing tax), while other forms of expenditure (price shield) are lowering inflation, which is thus weighing less heavily on purchasing power. In 2023, purchasing power per capita is projected to remain almost stable again (down 0.1%), supported notably by the increase in the average nominal per capita wage (5.9% growth in annual average terms in market sector industries).
This near stability of purchasing power in average terms in 2022 and 2023 is a positive surprise compared to our December projection. For a number of reasons, it may not coincide with household perceptions: the average change masks differences in individual experiences of inflation – for example, rural or older inhabitants have been more affected by energy price rises, and low-income households by food inflation. In addition, households are more frequent purchasers of those items that have seen the biggest price rises (energy and food), even though the latter only account for a quarter of total consumption, which means that they feel these price changes more keenly.
In 2024 and 2025, purchasing power per capita should pick up pace as inflation abates and per capita wages continue to rise, especially in real terms from the point of view of employees (measured by the average wage per capita adjusted for the consumer price deflator, see table page 8). Purchasing power per capita is projected to rise by 1.0% in 2024 and by 0.8% in 2025, which means that it should be 3.5% higher than its pre-Covid 2019 level.
The stagnation of purchasing power in 2022 and 2023 should have a temporary impact on household consumption, which should thus see weak growth of 0.4% in 2023. Indeed, households are only expected to dip moderately into their savings to smooth their spending, due to precautionary behaviour in the face of rising unemployment and lasting fears caused by the global geopolitical situation. However, consumption is then seen accelerating in 2024 (growth of 1.5%) and 2025 (growth of 1.6%) as purchasing power gains increase.
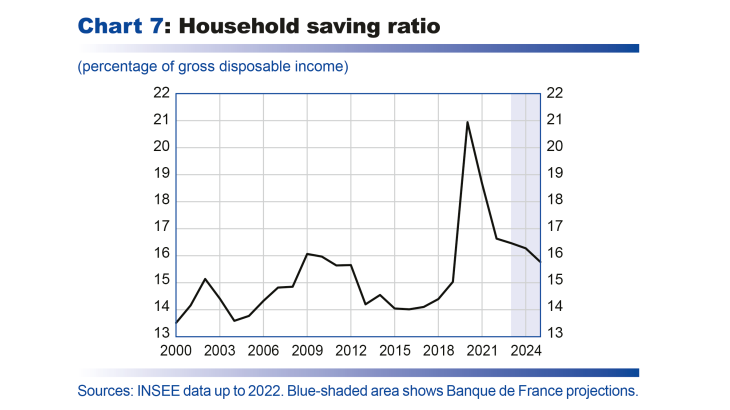
After peaking at the start of 2020 (21%) with the restrictions on consumption caused by the first lockdowns, the saving ratio fell to 16.6% in 2022. It should decline more slowly over the projection horizon, reaching around 16% in 2025 (see Chart 7), which is close to the maximum seen between the start of the 2000s and in 2019, as the uncertainty – and associated precautionary saving behaviour – is only seen dissipating gradually under our scenario.
Household investment, especially in purchases of new dwellings, was sluggish in 2022 (growth of 0.3%) amid the slowdown in purchasing power and tightening of financial conditions. It should fall sharply in 2023 and 2024, but this decline should peter out by 2025.
Corporate margins should also be less affected than previously anticipated
In 2022, businesses were hit by a rise in the cost of their intermediate inputs caused by energy price pressures. As productivity per capita slowed, unit labour costs (ULCs, ratio of the cost of labour to labour productivity) rose by 5.1% in 2022 in the market sector. Businesses partially passed on these higher costs to the price of value added (rise of 4.7%). This limited the aggregate decline in the non-financial corporation (NFC) margin rate to around two percentage points in 2022 compared with the record high seen in 2021 (see Chart 8). As in the case of household purchasing power, this decline is smaller than we predicted in December. Indeed, in 2022, businesses managed to pass through cost rises to prices to a greater extent than expected. The margin rate is therefore still close to its 2018 level (31.5%; we are using 2018 as the reference point for the pre-Covid period as 2019 was impacted by the double-counting of the Tax Credit for Competitiveness and Employment or CICE). In 2023-24, rising input costs and robust growth in ULCs should continue to weigh on margins, despite the abolition of the cotisation sur la valeur ajoutée des entreprises (CVAE – corporate value added contribution) over these two years. However, margins should still be higher than forecast in our December projections thanks to their higher level in 2022.
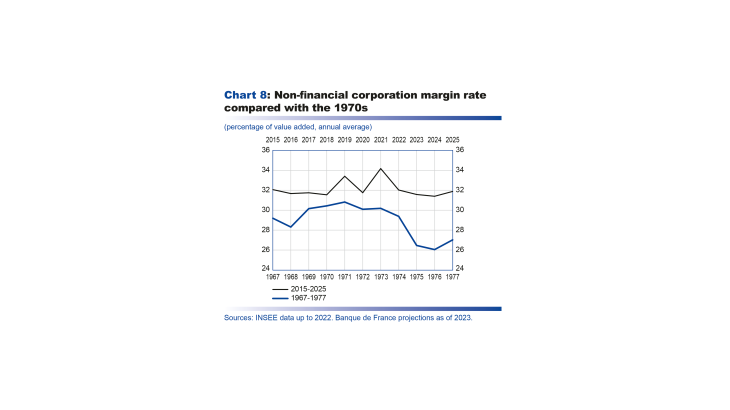
After that, as productivity growth picks up markedly with the recovery in activity and the closing of the productivity cycle, and nominal per capita wages slow more than the price of value added (see table below), the margin rate should start to rise again in 2025.
By the end of the projection horizon, the NFC margin rate is predicted to be back near its pre-Covid crisis level. This should limit the decline in the NFC investment ratio caused by tighter financing conditions and the slowdown in activity. The investment ratio is thus forecast to remain high over the projection horizon (25.4% in 2025) compared to its pre-Covid level (24.2% in 2019).
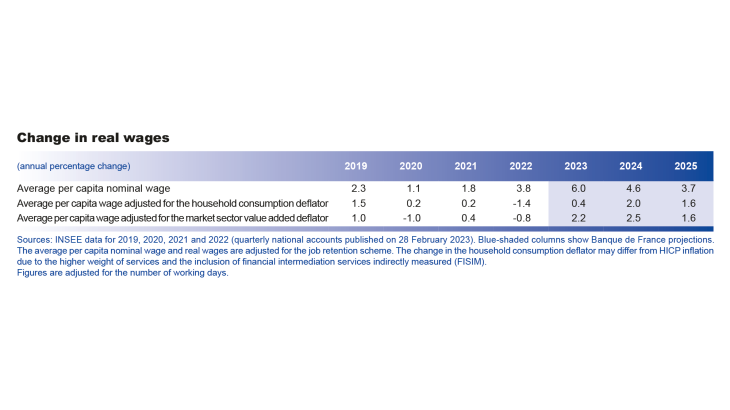
Government finances should thus largely offset the delayed adverse effects of the inflationary shock on households and businesses. However, this will come at a price. To protect households and businesses from higher energy prices, the government has implemented a series of mitigating measures, including the price shield, which will cost a gross total of nearly EUR 110 billion over 2021-23. Government expenditure should therefore remain high, keeping the debt-to-GDP ratio above 110% over the entire projection horizon.
The unemployment rate should only rise temporarily in 2023-24 amid the slowdown in activity and expected recovery in productivity gains; it should then start falling again in 2025
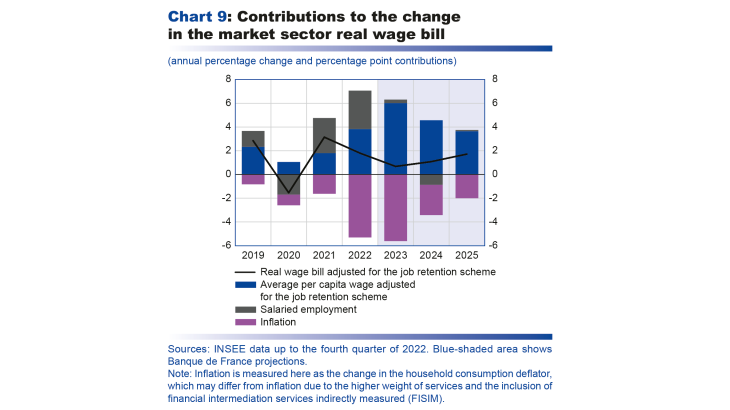
Employment gains remained very strong in 2022, with the private sector adding 337,000 net salaried jobs between end-December 2021 and end-December 2022, after 895,000 in 2021. These gains were supported in the first half by the lifting of the Covid-related restrictions and reopening of services, as well as by a continuing rise in the number of apprenticeship contracts. The job creations prevented the real wage bill from declining in the market sector in 2022 despite strong inflation (see Chart 9).
With activity slowing, however, the counterpart in 2022 to the robust employment growth was a near-stagnation of per capita productivity (growth of 0.1%) and a 3.3% decline in hourly productivity. After a decade of rising by 0.7% in annual average terms, productivity per capita fell over the period 2020-22 (down 1.4% per year). This loss of productivity is attributable to various factors. Some of these should prove temporary, for example, the rise in sick leave during the Covid crisis, or the decision by firms in some sectors still affected by the Covid crisis (e.g. transport equipment manufacturing) to hold on to staff in anticipation of the recovery. However, other factors should prove longer lasting, for example the increase in work-study contracts, which should continue over 2023-25.
In the fourth quarter of 2022, growth in private sector salaried employment slowed. Net job creations totalled 44,400 between end-September and end-December, compared with 87,500 over the three previous months. This supports our forecast for a slowdown. Market sector salaried employment should continue to weaken in 2023 and 2024, reflecting the slowdown in activity and a moderate pick-up in productivity gains.
Job creations are projected to rise again over 2025, slightly lagging the recovery in activity. There should notably be an increase in market sector salaried jobs.
Productivity gains should also be larger in 2024 and 2025 (2.4% and 2.0% respectively), and higher than the average of 0.7% over the period 2010-19. This is expected to make up for some of the losses observed since 2020. However, the size of this catch-up is subject to uncertainty, posing a risk to our employment and unemployment projections (see Box 2).
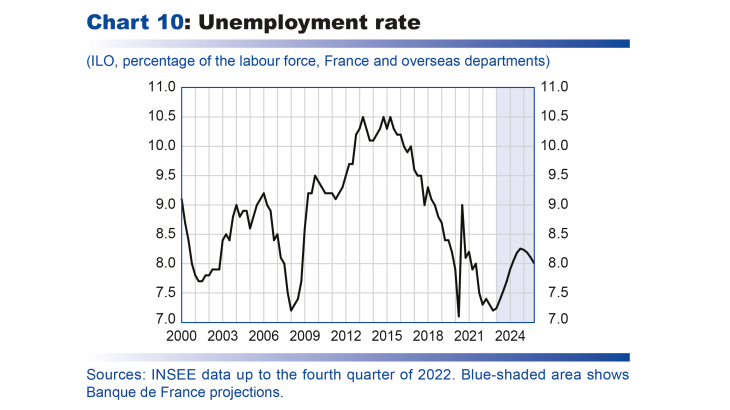
The unemployment rate should thus follow a bell-shaped trajectory, rising first from its current low level due to the sharp slowdown in growth and recovery in productivity, then falling back over 2025 (see Chart 10). It is then seen coming back towards its pre-Covid end-2019 level, which was historically low compared with the 2010s.
Box 2 : Uncertainty over the scale of the recovery in productivity and implications for the employment and unemployment rate forecasts
In the market sector, labour productivity has fallen from its pre-Covid trend (see text supra and Table E2 in the appendix). In our baseline projection scenario, around half of this loss is expected to be lasting and is explained by the increase in apprenticeship contracts, the Covid crisis and the energy crisis. Other factors, deemed temporary, are seen receding over the projection horizon: retention of staff, especially in the energy and transport equipment sectors, and the additional absences for sick leave linked to the public health crisis. However, there is some uncertainty over the share of productivity losses that will prove permanent. To illustrate the sensitivity of our employment and unemployment forecasts to this uncertainty, we present two alternative scenarios based on different assumptions for productivity gains and with unchanged activity forecasts.
In the high-end scenario, characterised by higher productivity gains, the lasting productivity losses are smaller than in our baseline scenario, and are assumed to be limited to 25% of the gap in productivity versus its pre-crisis trend. Under this scenario, the increase in work-study contracts weighs less on productivity, business failures return more rapidly to their pre-crisis level, which weighs on employment, and productivity gains are consequently higher over our projection horizon. Average productivity gains are estimated to reach 2.2% each year compared with 1.7% in our baseline scenario (see table). Assuming the same level of activity, market sector salaried employment falls by a cumulative 363,000 jobs over the period 2023-25, and the unemployment rate rises to an average of 9.0% in 2025.
In the low-end scenario, with smaller productivity gains, the share of lasting productivity losses is larger, at around 75%. A portion of the temporary productivity losses (additional sick leave during the public health crisis, retention of staff) recedes over the projection horizon. Under this scenario, productivity gains remain lower than in our baseline scenario owing to sectoral difficulties (in energy and transport equipment) that partially last beyond our projection horizon, and the creation of work-study contracts that have a larger downward impact on productivity. Productivity gains amount to 1.2% on average per year between 2023 and 2025, which means that, assuming the same level of activity, 215,000 jobs are created (compared with the 93,000 destroyed under our baseline scenario). Under this scenario, the unemployment rate falls to an average of 7.1% in 2025 and is 0.2 percentage point below the average observed in 2022, compared with 0.8 percentage point higher in our baseline scenario.
These scenarios are purely illustrative and need to be interpreted with caution as the change in activity is assumed to be the same in each case.

New sources of uncertainty
There are still numerous risks to activity and inflation, but they have evolved since our last projections.
Compared with our previous publication, the negative risks linked to possible energy supply shutdowns and their potential impact on activity have been averted for winter 2022-23. However, the geopolitical situation linked to Russia’s war against Ukraine and to the global environment, with the possibility of a resurgence of energy supply pressures next winter, still poses an upside risk to inflation and a downside risk to growth for the end of 2023 and start of 2024.
Another risk to our inflation forecast is that the food price rises announced after the end of talks between large retailers and producers on 1 March might persist for longer than currently anticipated, even though our projections already factor in further price rises over the coming months. On the downside, however, the recent falls in wholesale gas and electricity prices could have a stronger than expected negative impact on producer prices and hence on consumer prices of manufactured goods and food.
The reopening of the Chinese economy after the end of the “zero Covid” policy should help to buoy global trade and the exports and activity of euro area economies in 2023. The risks to inflation are more mixed. On the one hand, an acceleration of activity in Asia’s principal economy could place upward pressure on commodity prices. On the other hand, the lifting of public health restrictions in China could help global value chains return to normal and alleviate the inflationary pressures on manufactured goods prices caused by supply bottlenecks.
Last, regarding the impact of monetary policy tightening in our models, there is significant upside and downside uncertainty over the scale of its transmission and the amount of time this takes.
Moreover, the indirect effects of the recent banking sector and financial volatility also need to be monitored closely, as underscored by the recent events caused by the closure of Silicon Valley Bank in the United States and the uncertainty over Credit Suisse.
Appendices
Read the appendicies
Update of the weighting of items in the Harmonised Index of Consumer Price (HICP)
The Harmonised Index of Consumer Prices (HICP) aggregates the prices of each item of consumption according to a fixed weight during the year. The French statistics office INSEE modifies these weights in January of each year to reflect changes in the structure of the household consumption basket. For 2023, the weights have been updated to reflect changes in the basket over 2022, which are quite significant. The weight of food expenditure has declined from 21.0% to 20.3% of the total household consumption basket and is now in line with its 2020 level (20.3%, based on 2019 consumption). Similarly, energy has fallen from 10.3% to 9.9% but this is still well above 2020’s level of 9.2%, reflecting the strong growth in energy prices between 2019 and 2022. Conversely, the weight of services has risen sharply between 2022 and 2023, from 43.6% to 46.3%. This reflects a normalisation of spending volumes on certain services in 2022 (transport services, accommodation and food services) after the sharp drop caused by the public health restrictions.
Under normal circumstances, the structure of household consumption changes very slowly from one year to the next, so that the effects of weight changes on the HICP inflation measure are negligible. However, the large shifts in weights for 2023 compared with 2022 are affecting the year-on-year change in the HICP. More specifically, the normalisation of the consumption basket is having the opposite effect on inflation to the major shift in consumption weights seen in 2021. This is impacting certain components of the index in particular, although this is being offset to an extent in the headline HICP reading.
In 2023, for example, the weight of air passenger transport in the consumption basket has increased to 1.2% from 0.5% in 2022, and is now at the same level observed in 2020 (1.2%). Yet in January, the air transport price index usually drops markedly after the seasonal peak seen in December. As the weight of air transport is higher in 2023 than in 2022, the fall in prices between December 2022 and January 2023 is having a bigger negative impact than at the same time last year. In January 2021, there was an equivalent positive impact, reflecting the sharp drop in the weight of air transport.
In the case of headline inflation, for the month of January 2023, the update of the weights made a modest contribution to the year-on-year change in the HICP, of just -0.1 percentage point, essentially due to services where the usual price falls in air transport had a higher weight than previously. In addition, the effect of the weight changes also depends on the expected changes in the relative prices of different products.
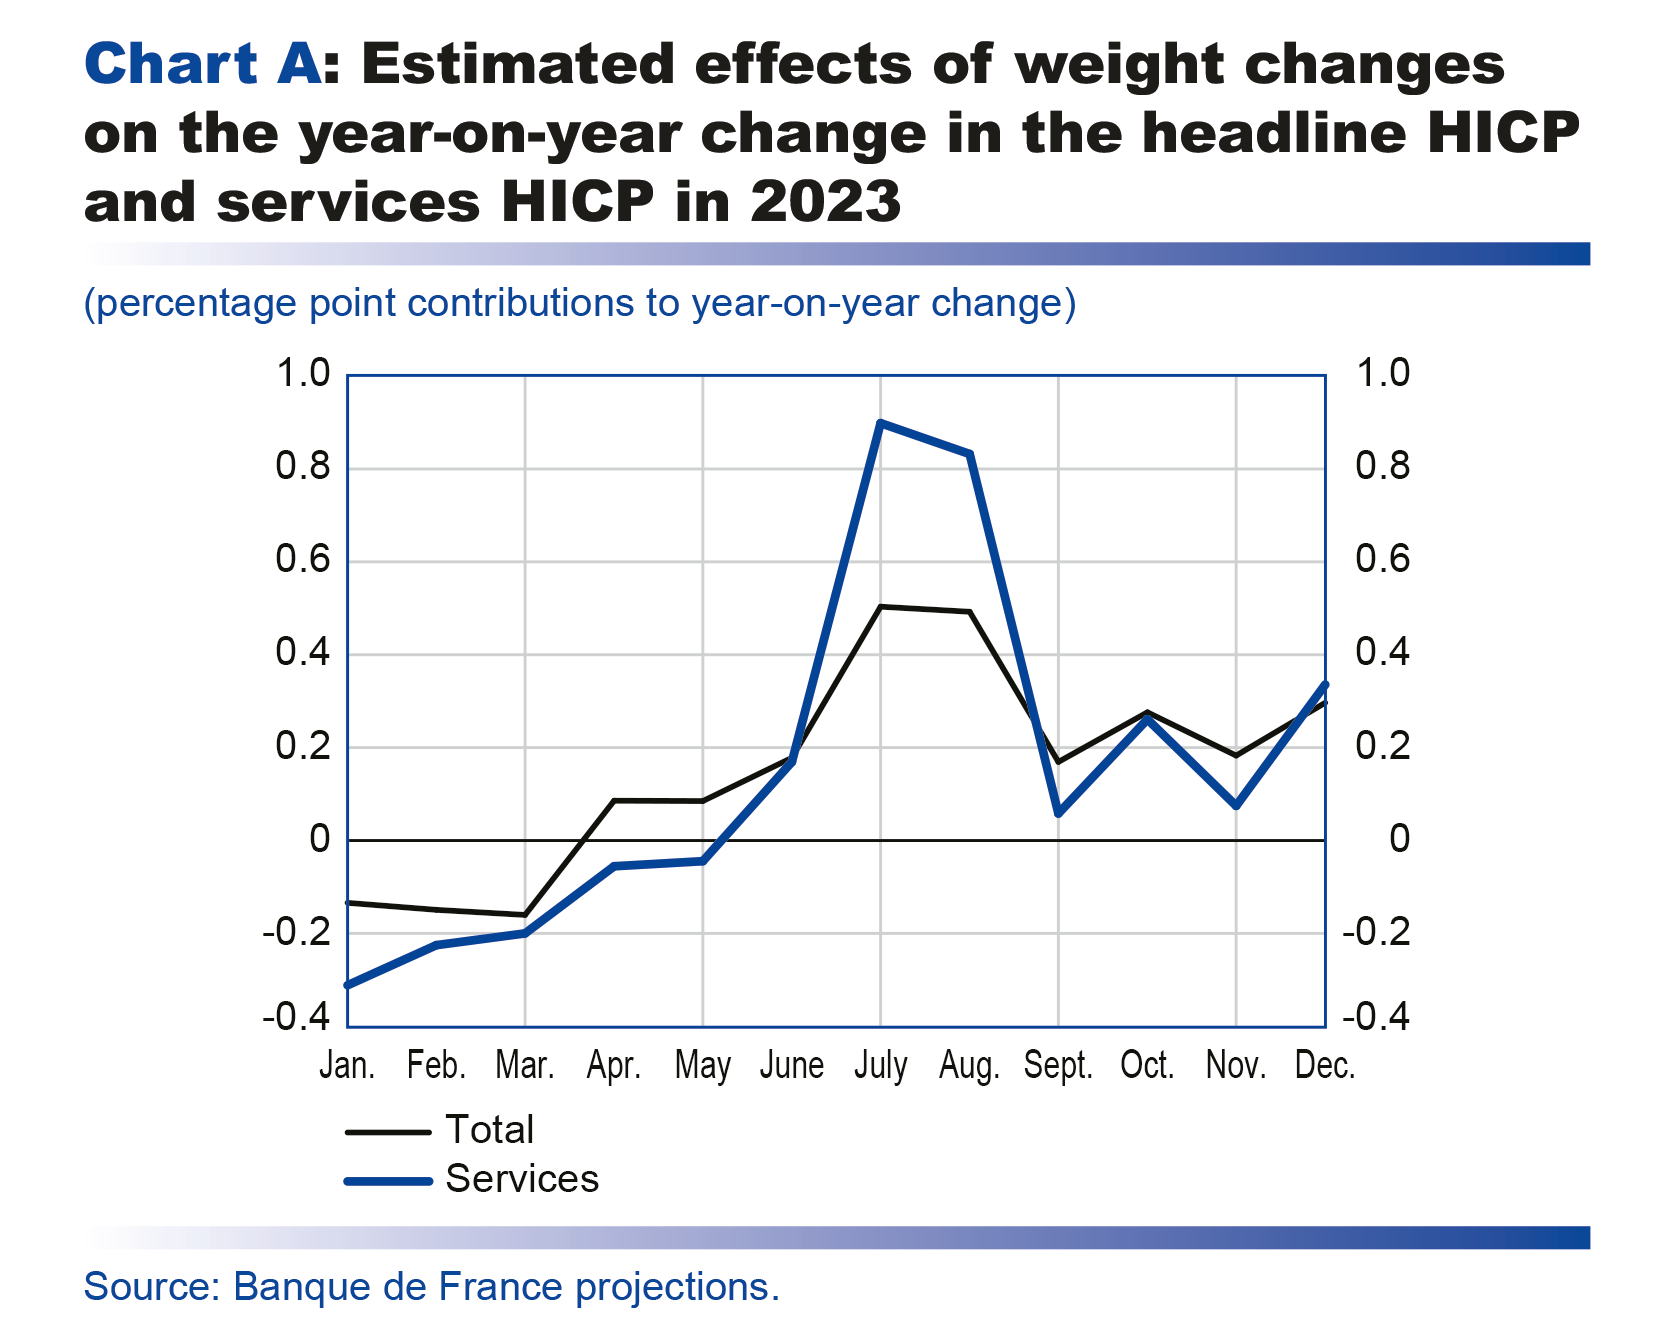
Chart A shows the expected effects of the weight changes for 2023. We estimate that they will have a +0.2 percentage point impact on headline HICP inflation on average, and a +0.1 percentage point impact on HICP inflation excluding energy and food. The effects are predicted to vary over the year: they should be negative in the first quarter of 2023 (as in January), positive overall in the second quarter, positive again and more significant in the third quarter, and positive but more moderate in the fourth quarter. These variations in the effects of the weight changes will essentially be due to services, and especially air transport and accommodation services. The estimated positive impact in the third quarter will be the inverse of the negative impact in the first quarter, as the price indexes for air transport and accommodation peak in the summer and will make a bigger contribution to headline inflation in 2023 than in 2022 due to the increase in their weights.
The regular updates to the HICP component weights are designed to better reflect the structure of household consumption and need to be understood. But the overall effect on annual average inflation is limited in our projections.
Eurosystem technical assumptions
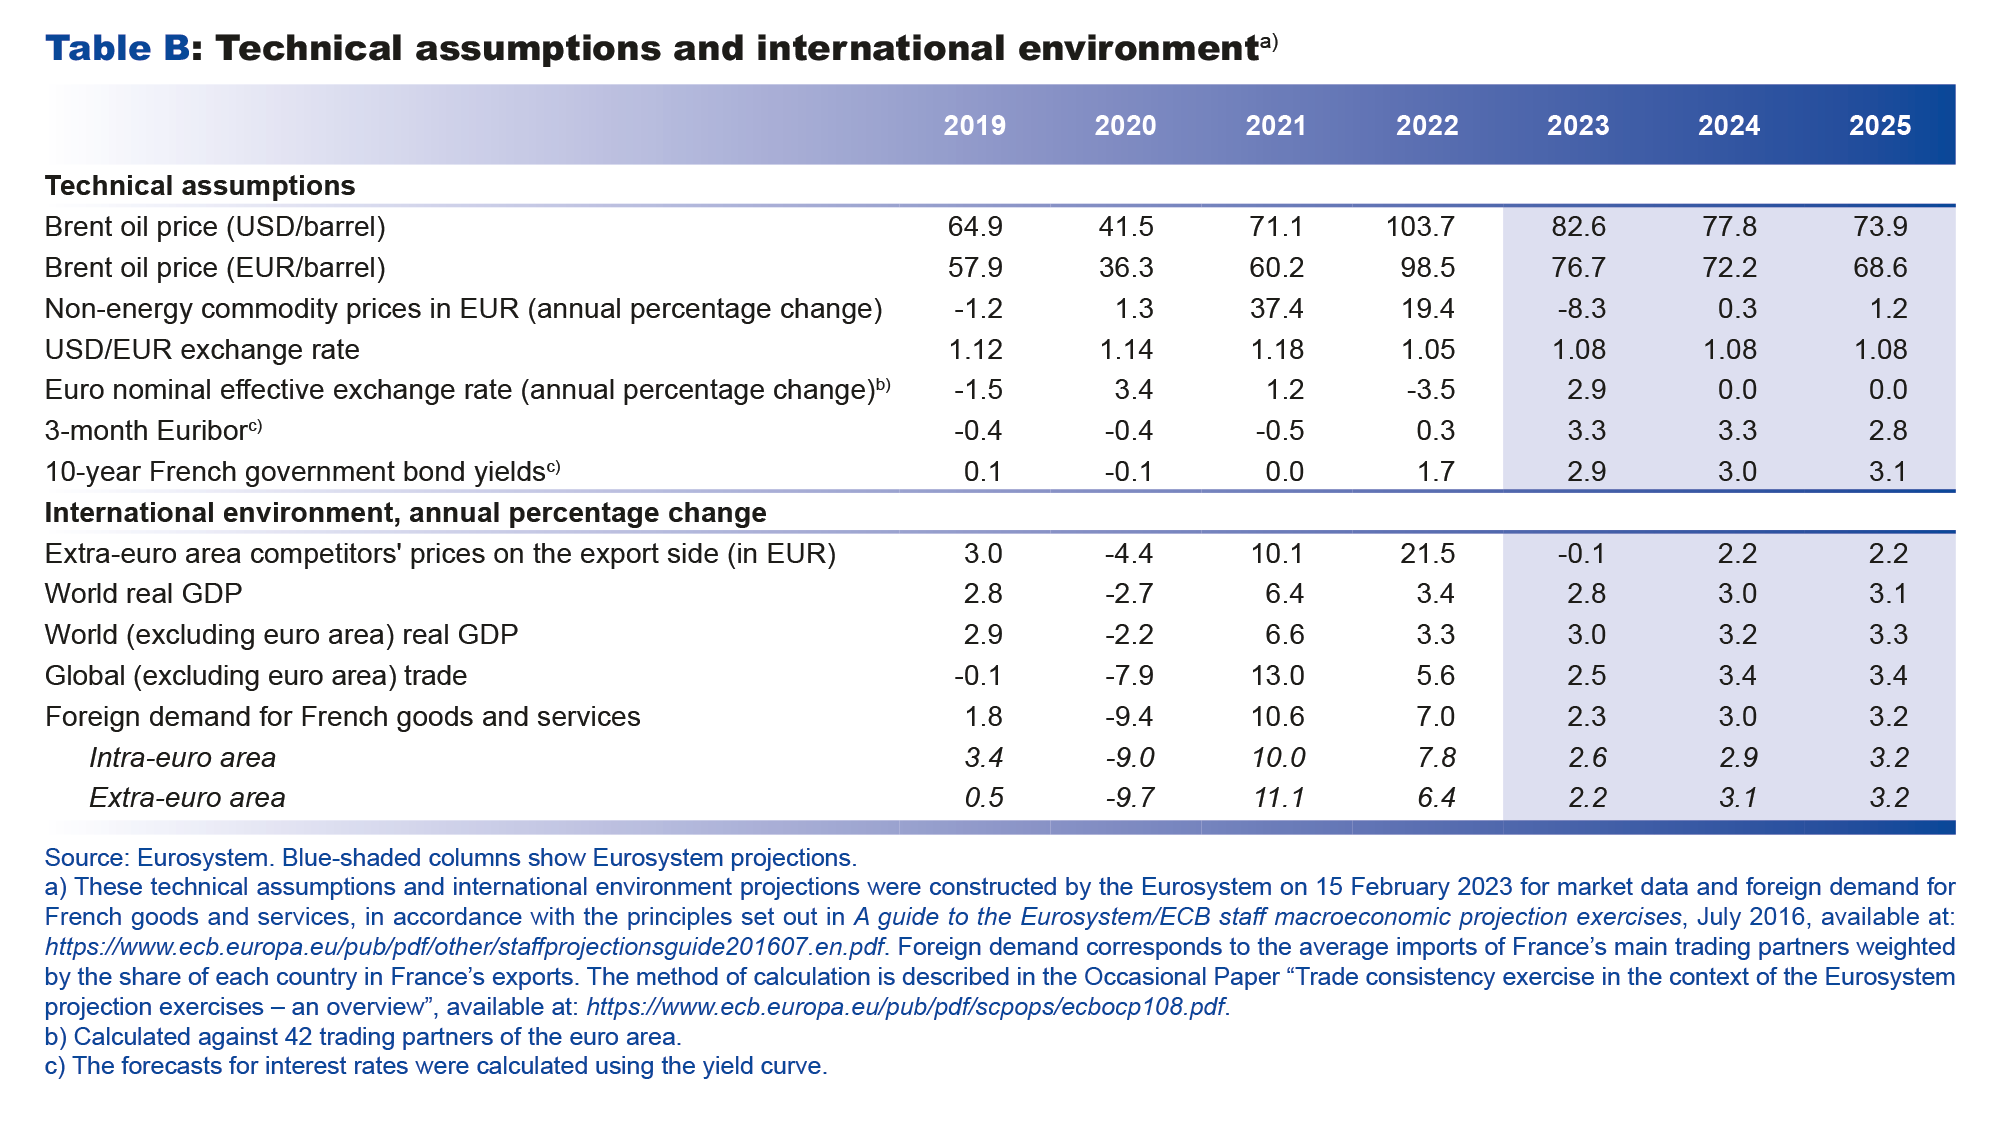
Key year-end projections for France

Detailed technical projections and contributions to GDP growth
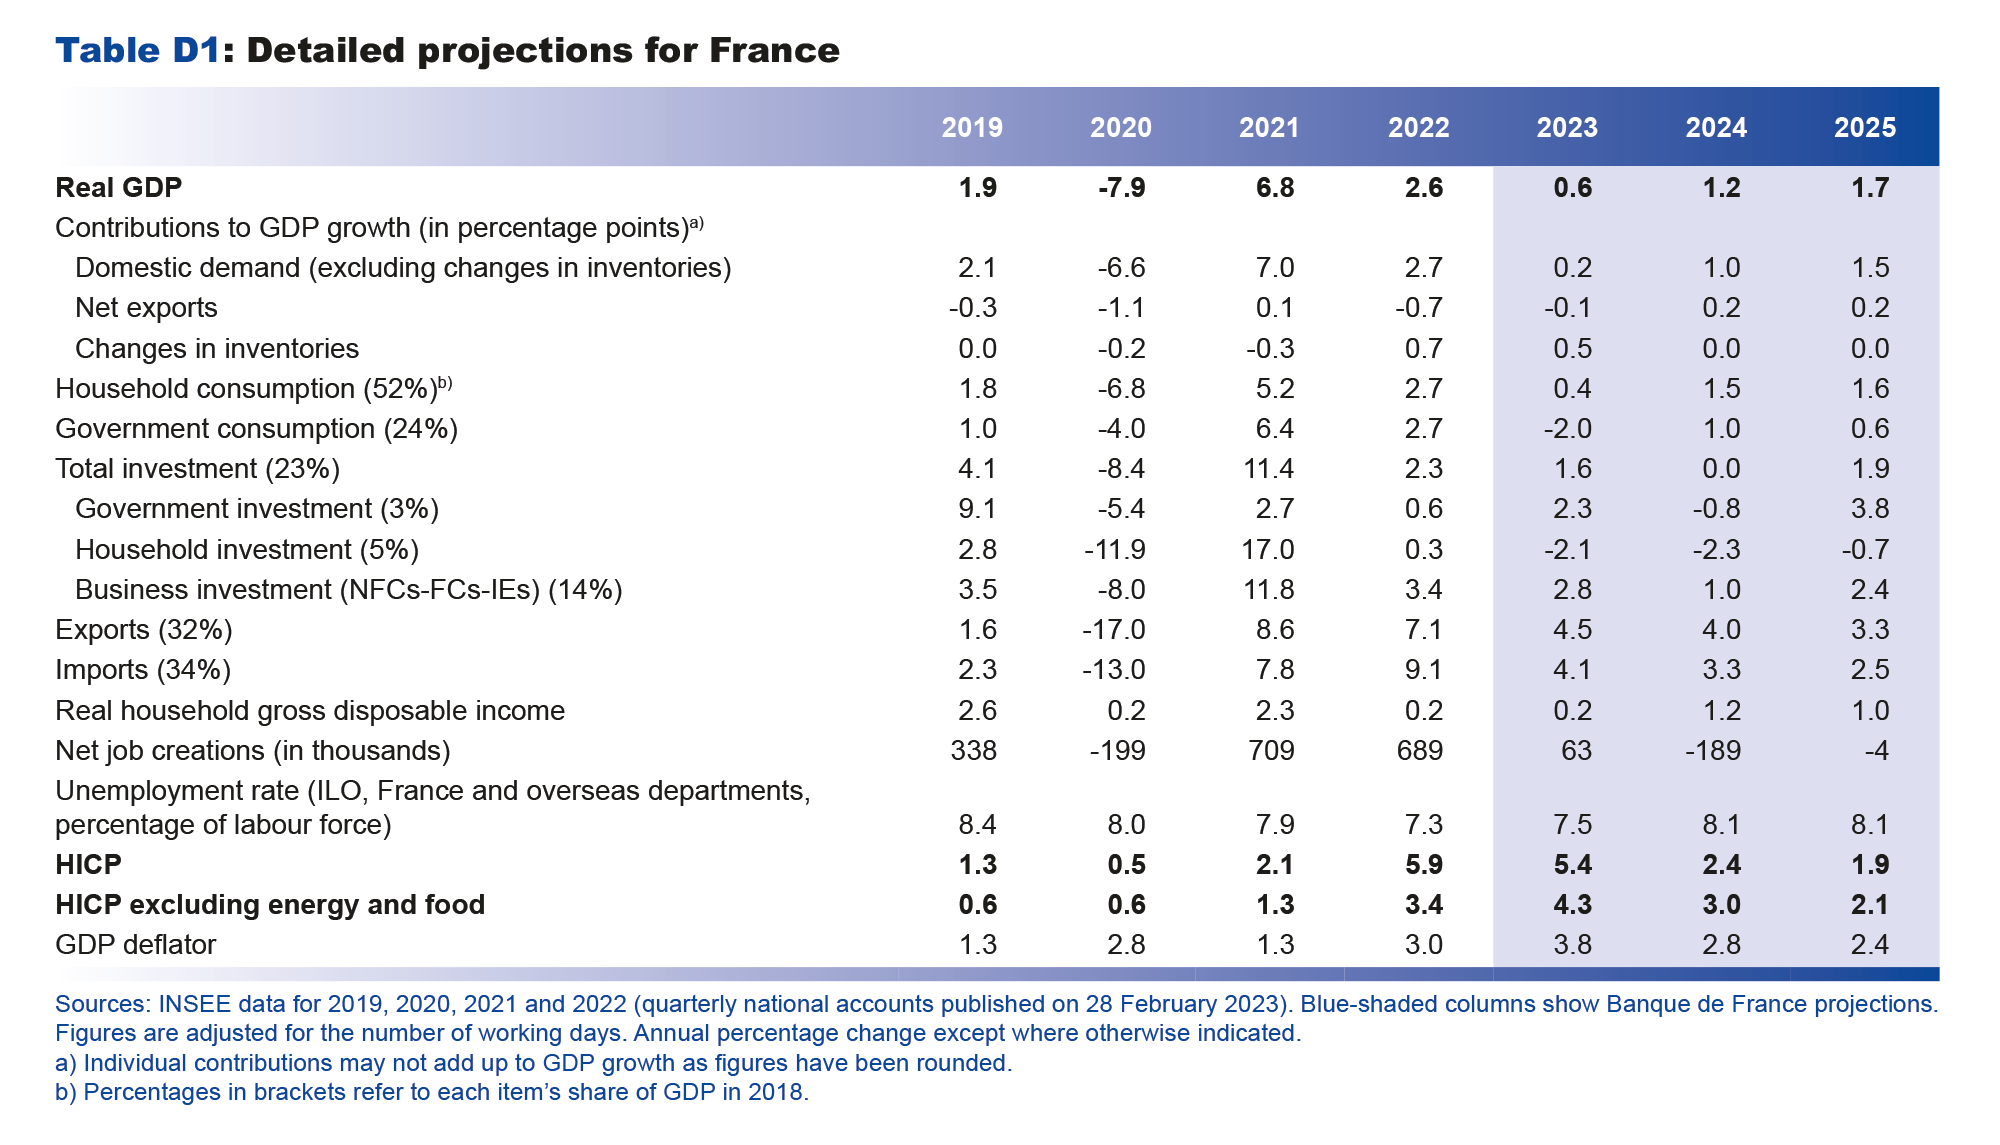

Additional indicators



Download the PDF version of this document
Updated on the 25th of July 2024
