Introduction
- Overall, our growth and inflation projections for the French economy up to 2025 confirm those published in March. The French economy should succeed in progressively overcoming inflation without slipping into recession, albeit with a marked economic slowdown. That said, a more detailed analysis shows a number of underlying revisions to the figures.
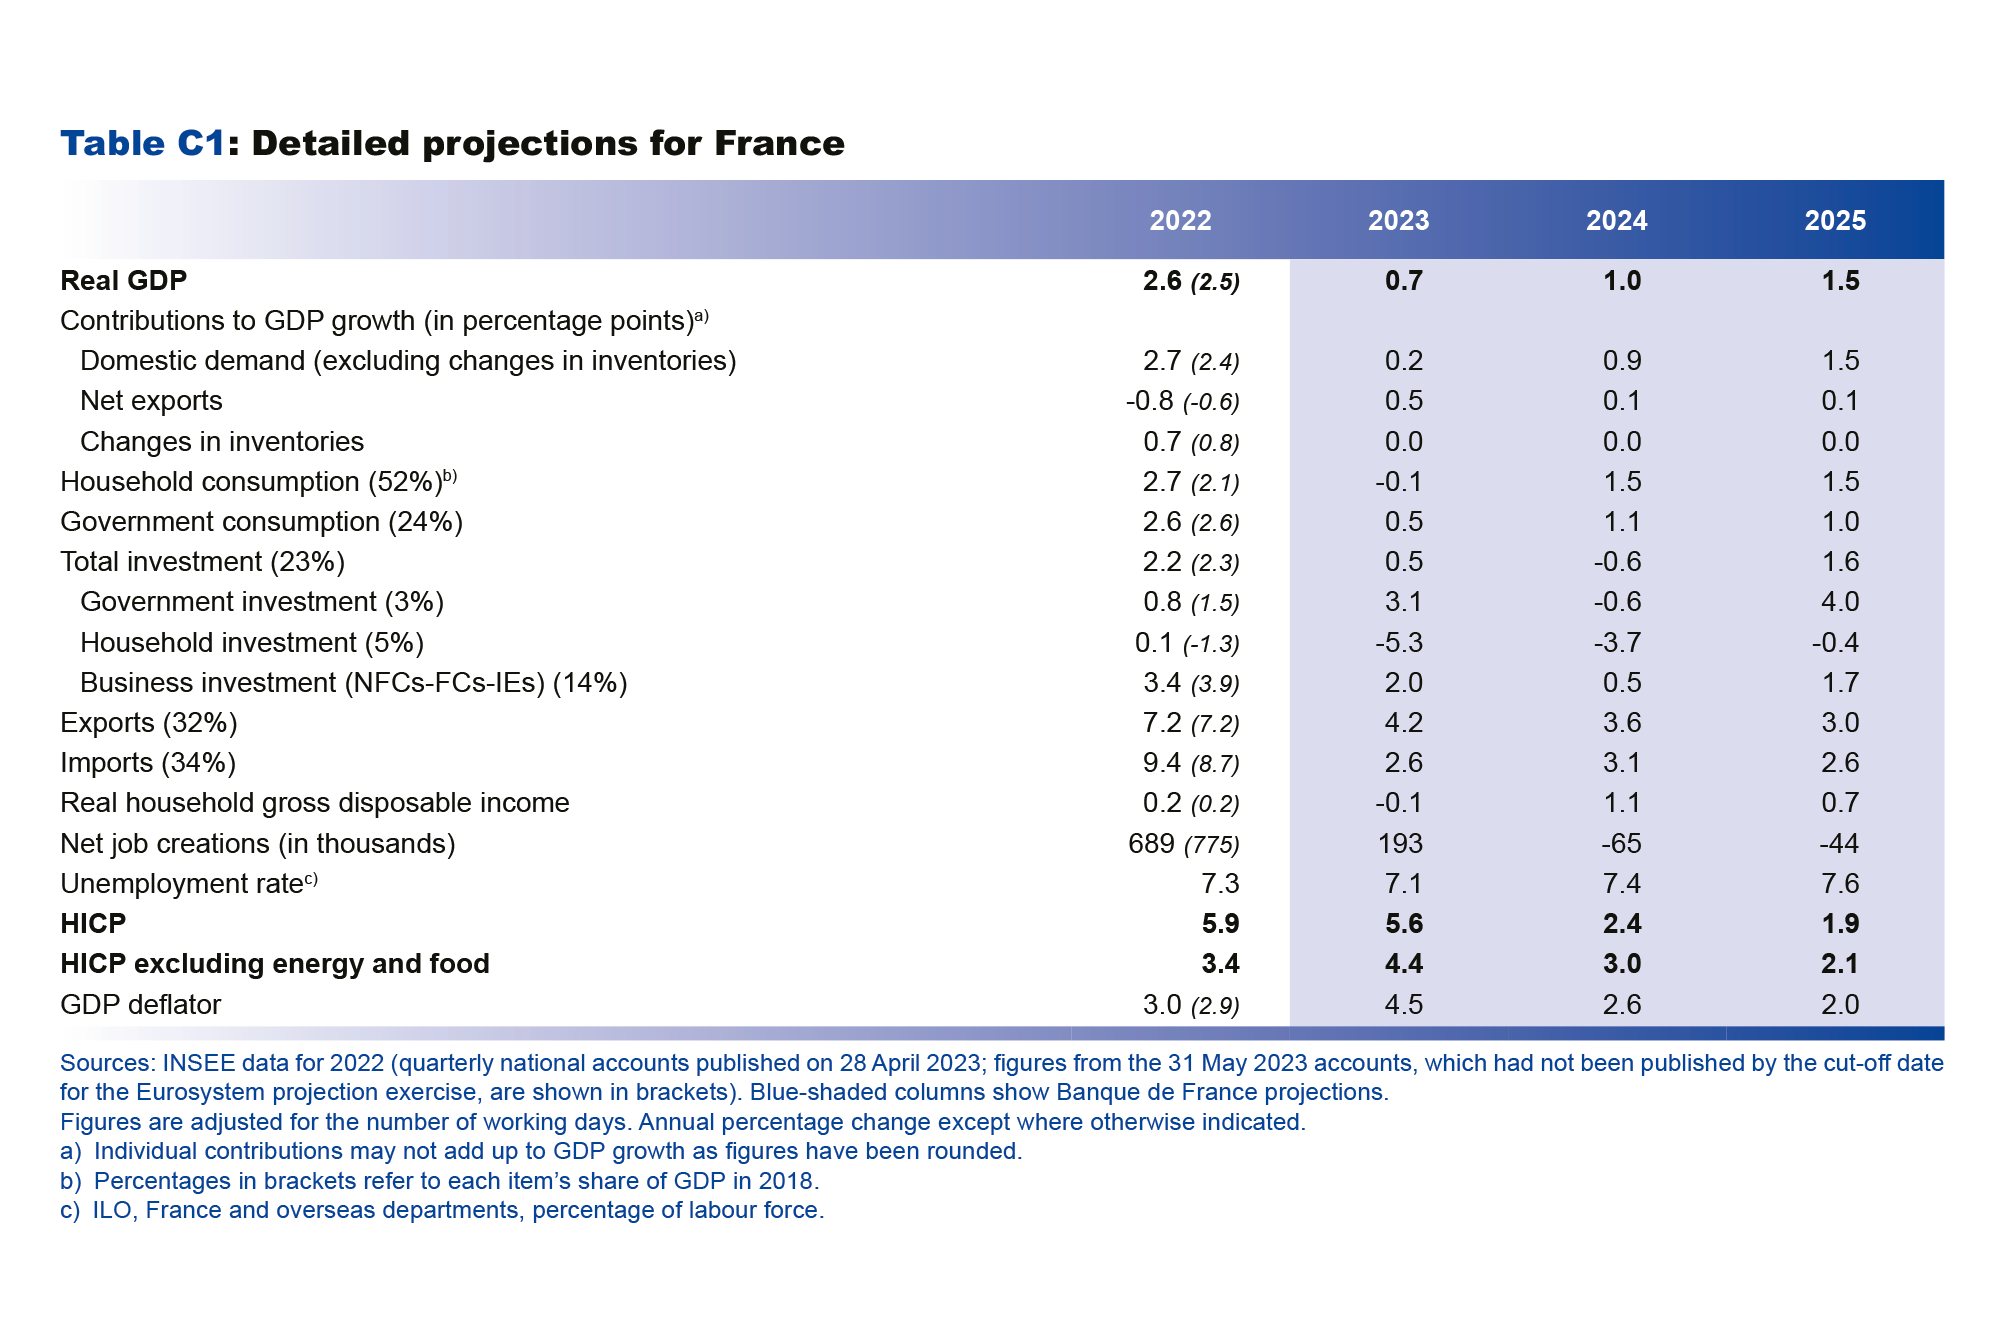
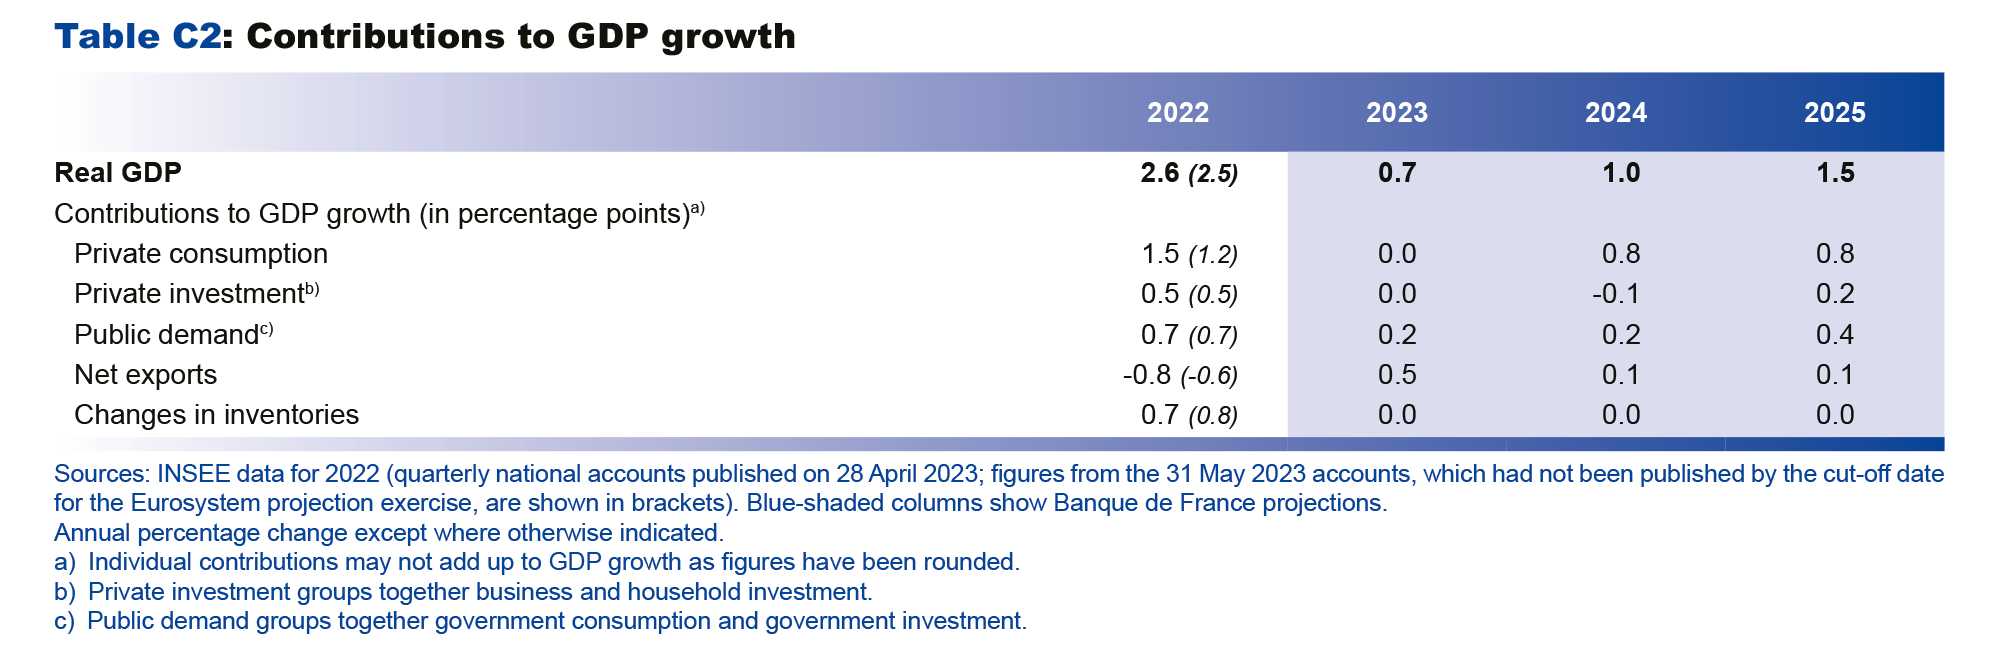
- With energy prices normalising and the risk of supply cut-offs now averted, economic growth appears moderate but resilient at the start of this year. Our growth forecast for 2023 has been revised up slightly to 0.7%. Nonetheless, the absorption of the major past shocks, including by our trading partners, means that French growth is now seen recovering slightly more gradually than previously expected, with GDP rising by 1.0% in 2024 and 1.5% in 2025. The external environment should be slightly less favourable than we anticipated in March, and we expect the recovery in foreign trade and French exports to remain sluggish. The much-needed tightening of financing conditions should gradually have a moderating impact, not just on inflation but also, temporarily, on investment. Household consumption is only expected to pick up gradually.
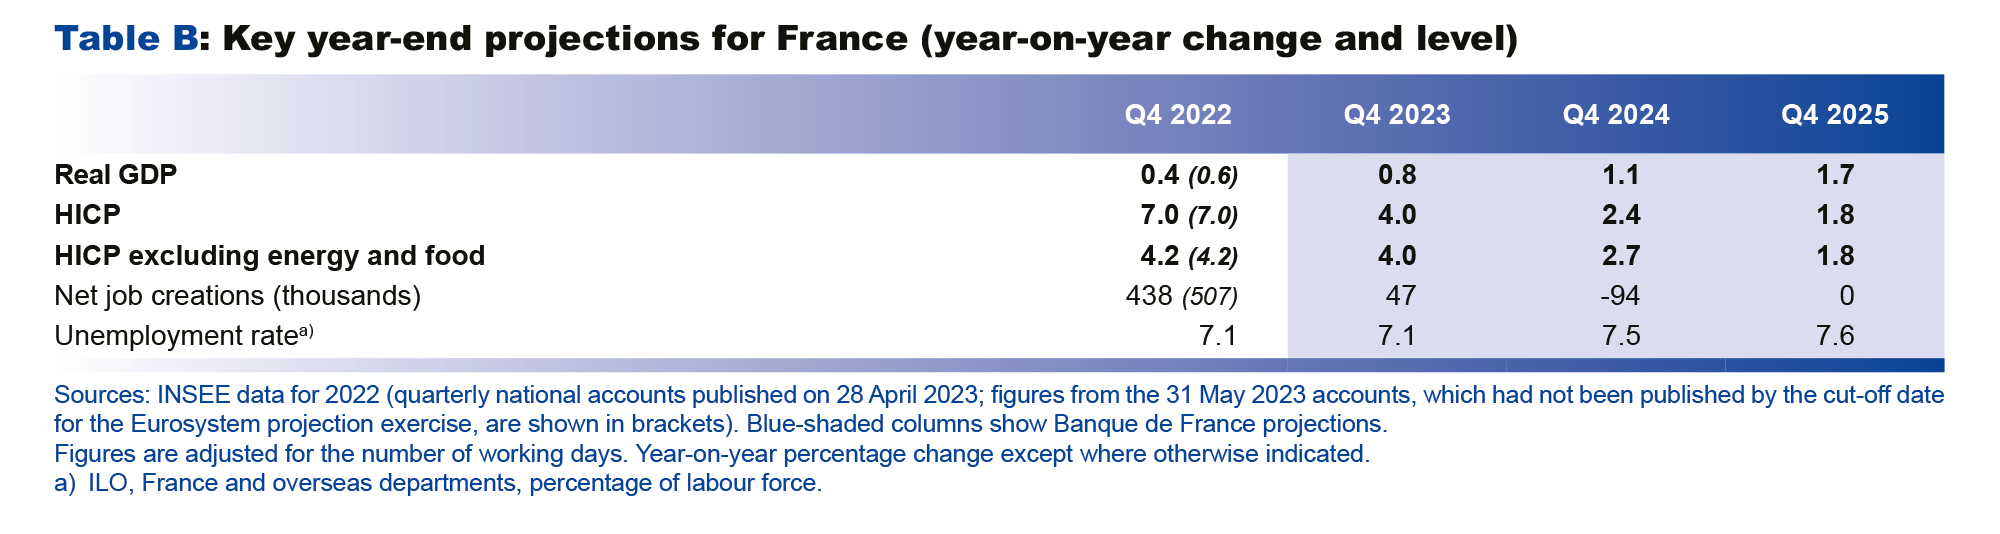
- After peaking in the second quarter, headline inflation as measured by the Harmonised Index of Consumer Prices (HICP) is projected to subside gradually in the second half of 2023 and beyond, coming back towards 2% by 2025, provided there are no new shocks to commodity import prices. In annual average terms, HICP inflation should be 5.6% in 2023 and 2.4% in 2024. It has been revised upwards slightly for 2023 compared with our March projections, reflecting a slightly more persistent rise in food prices. Year-on-year, it should already have come back down to 4% by the final quarter of 2023. Core inflation (HICP excluding energy and food) is projected to fall more slowly due to more persistent growth in wages and services prices. However, it is also expected to come back towards 2% by 2025, thanks to the full transmission of the current monetary tightening.
- We have made significant revisions to our projections for employment (upwards) and unemployment (downwards). This reflects the developments observed over recent years which point to a rise in the employment content of growth. The unemployment rate is expected to rise very moderately over our projection horizon, reaching 7.6% in 2025, which is still well below pre-Covid rates.
- The government deficit, which could reach or even exceed 5% of GDP in 2023, is anticipated to remain above 4% of GDP up to 2025. The government debt-to-GDP ratio is only projected to stabilise at slightly above 110% of GDP by 2025, whereas it should fall markedly in the rest of the euro area.
- There are still numerous risks surrounding our projections, but overall they are balanced.

After the past shocks, economic activity should grow at a slower pace in 2023 before recovering progressively in 2024 and 2025
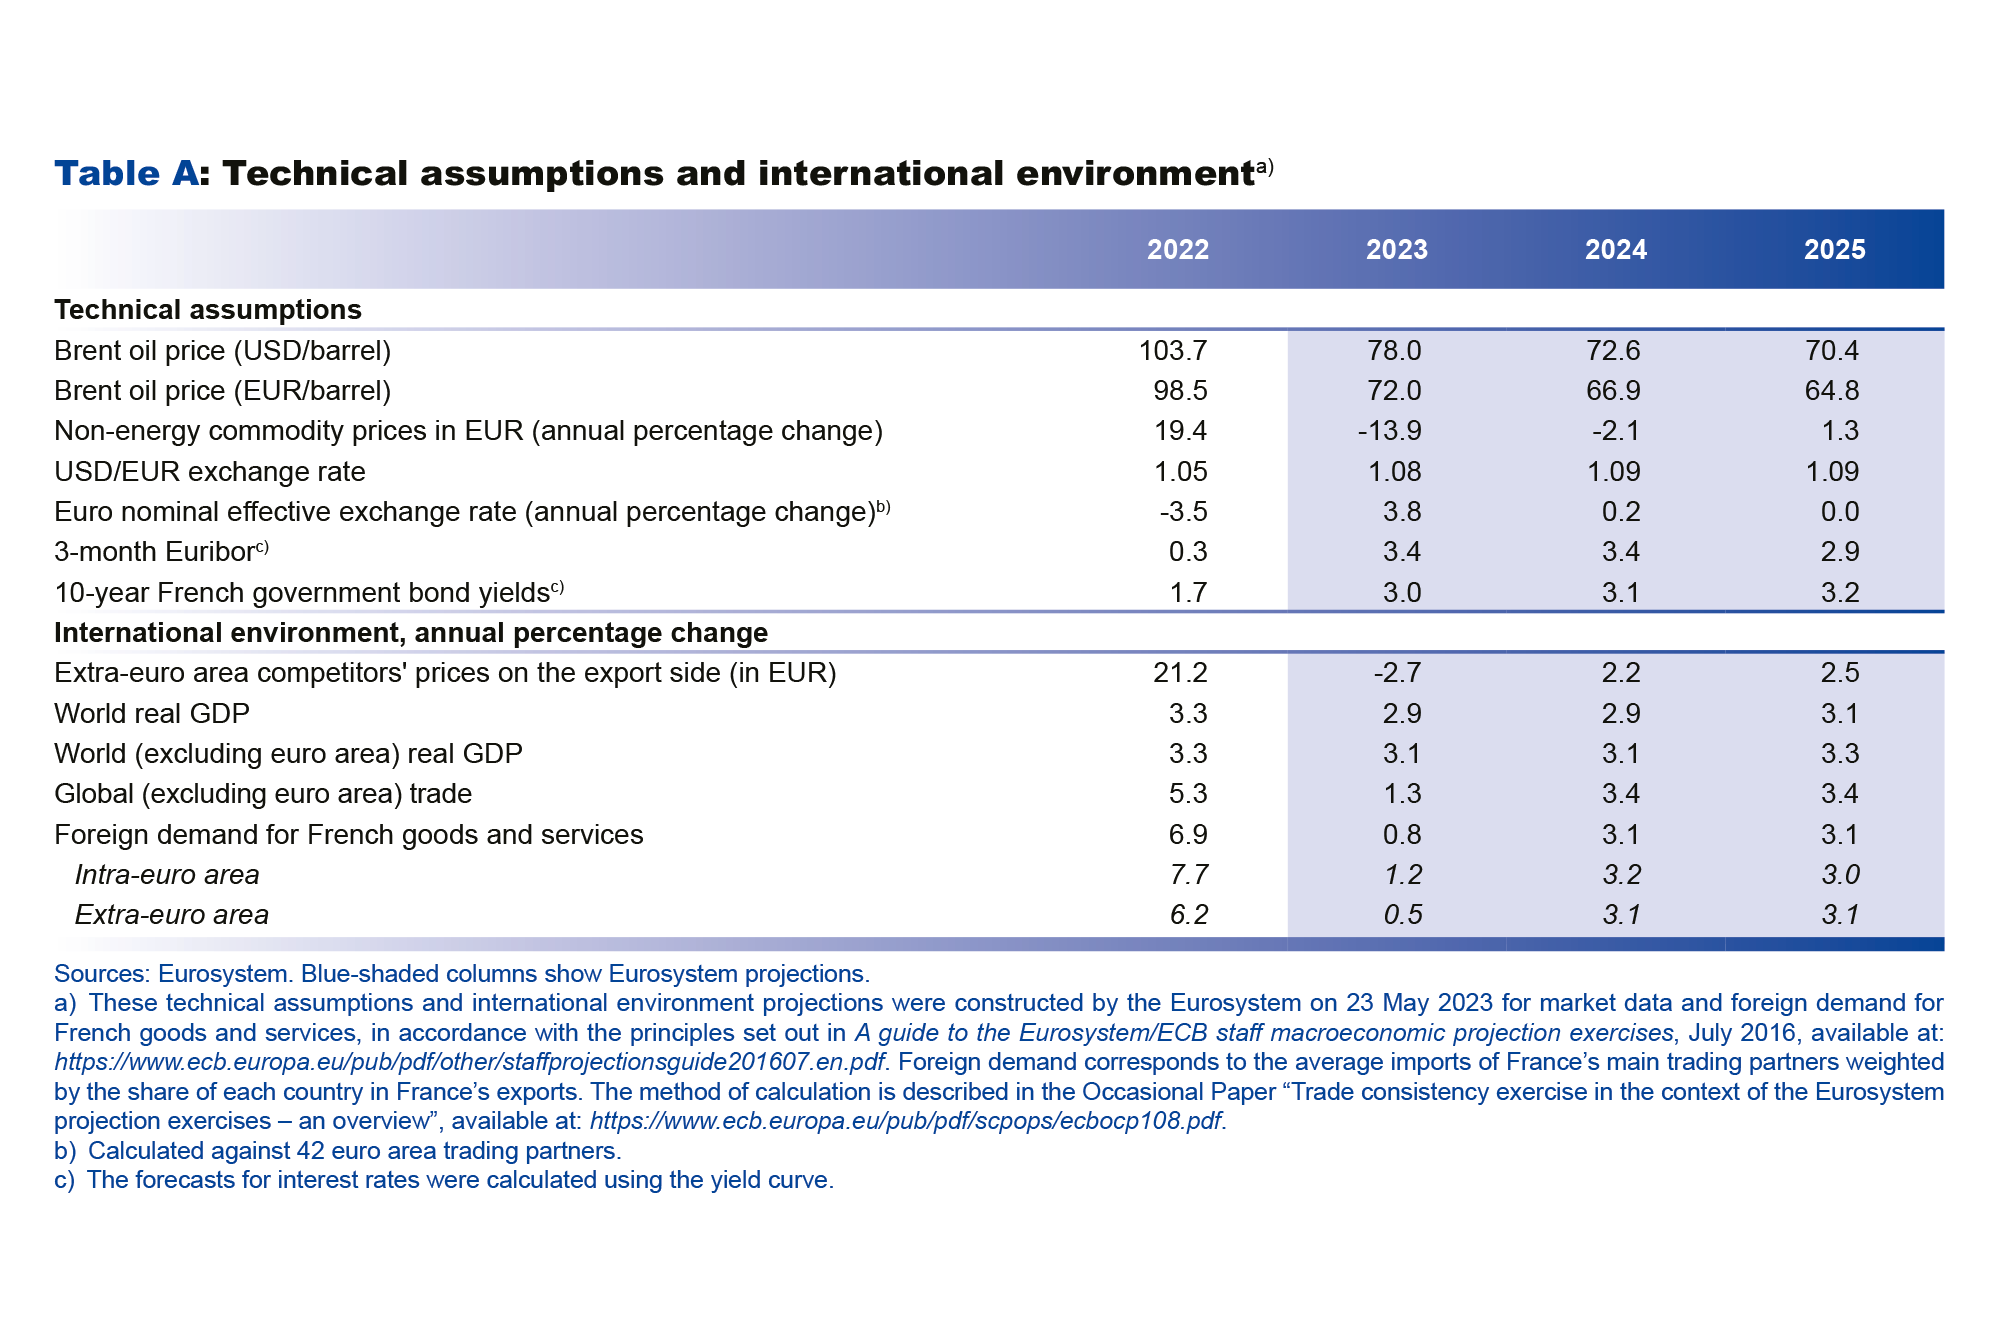
These projections were finalised at the end of May and incorporate the first estimate of the first quarter 2023 national accounts published by INSEE on 28 April 2023, the first estimate of HICP inflation for May published on 31 May 2023, and the short-term economic data from the Banque de France’s second quarter business surveys. They are also based on Eurosystem technical assumptions, for which the cut-off date is 23 May 2023. They do not take into account the detailed figures for the first quarter 2023 national accounts published on 31 May 2023, which also incorporate the provisional annual accounts for 2022. However, as indicated in the box on page 3, the implications of these new figures for our macroeconomic projections are on the whole limited.
From mid-2022 onwards, French GDP growth initially proved fairly sluggish due to the fading of the post-Covid recovery and repercussions of the external tax shock linked notably to Russia’s invasion of Ukraine.
In 2023, after a stronger-than-expected first quarter (quarterly growth of 0.2%), activity is now projected to expand by around 0.1% in the second quarter of the year. In the second half, activity should continue rising at a moderate quarterly rate of around 0.2%.
Overall, economic growth is projected to be 0.7% in annual average terms in 2023, which represents a slight upward revision (+0.1 percentage point) compared with our previous forecast. This limited revision reflects various different factors. On the upside, in our baseline scenario, we are no longer anticipating any energy supply difficulties. We have also revised our public demand forecast upwards, notably to reflect an increase in in-kind welfare benefits that is consistent with the stability programme. In 2023, these factors should offset the less favourable than expected developments in the international environment (downward revision to foreign demand for French goods and services, upward revision to the euro exchange rate), the negative impact on household purchasing power and consumption of the recent upward revision to inflation compared with March, and the effect of the tightening of lending conditions on household and business investment.
Helped by the easing of energy prices that began at the end of 2022 and that we assume, based on futures prices, will continue up to 2025, the economy should enter a recovery phase in 2024 and gather further pace over 2025, with annual average growth seen at 1.0% in 2024 and 1.5% in 2025. Household consumption should also regain momentum as inflation subsides. Compared with our March forecast, activity is seen slowing to a lesser extent in 2023, but is subsequently expected to return to its pre-Covid trend slightly later (see Chart 1 ).

The impact of the external tax shock is forecast to ease markedly over our projection horizon. In 2022, the deterioration in terms of trade imposed an extra cost on the French economy of around one and a half per cent of GDP compared with 2021 (see Chart 2), which translated into a surge in inflation and a loss of real income for both households and businesses. This terms of trade shock should subside in 2023 as pressures on energy and other imported commodity prices ease (see Chart 3), and we expect it to amount to around 0.7% of GDP, again compared with 2021. It is then seen diminishing further to 0.4% in 2024 and 2025, weighing less and less on activity ; moreover, the residual effects of the shock should increasingly be offset by adjustments to France’s economic fabric (such as energy savings and the diversification of energy sources).


Headline inflation seems to have passed its peak in the second quarter of 2023. In the absence of any further shocks, it should come down gradually towards 2% by 2025, although with its individual components following different trajectories
After peaking at 7.3% in February 2023, inflation as measured by the Harmonised Index of Consumer Prices (HICP) has declined on the whole over the past few months, reaching 6.0% year-on-year in May (see Chart 4). Inflation excluding energy and food fell to 4.4% year-on-year in May 2023 from 4.7% in April.


Although energy prices were supported by a number of temporary factors at the start of the year (rises in regulated gas and electricity prices in January and February, impact of the strikes in March on distribution margins and oil-related product prices), the drop in the energy component of the HICP was confirmed in May, reflecting the decline in oil prices. Food inflation also appears to have started to moderate in May – from its previous high rates which were fuelled by sharp growth in producer prices up to early 2023 and their pass-through to final prices at the end of February following commercial talks over major national food brands. Year-on-year growth in manufactured goods prices has also been easing for several months, reflecting smaller rises in producer prices since the end of 2022. However, after remaining stable at 3.6% year-on-year from October 2022 to January 2023, services inflation edged up to 4.0% in May 2023, fuelled notably by wage rises.
Over 2023, in the absence of any further shocks, headline inflation is predicted to recede markedly, essentially in the second half of the year. In annual average terms, it should come out at 5.6%, while inflation excluding energy and food is expected to be 4.4%. In the fourth quarter of 2023, headline HICP inflation and HICP inflation excluding energy and food should both be around 4.0% year-on-year. This marked fall in the headline inflation reading in the second half of 2023 masks contrasting trends in the index components as relative prices adjust.
Retail energy prices are projected to fall steeply in 2023, tracking international wholesale prices which began to retreat in the fourth quarter of 2022 – especially those of oil and gas. Based on European gas futures prices, which have come back to their summer 2021 level, final household prices are not expected to rise significantly in the second half of 2023 after the abolition of regulated prices in July. At the same time, electricity inflation should continue to be kept in check by the extension of the price shield until 2025, a measure announced by the government at the end of April.
Although we expect food inflation to prove stickier, it should then fall back sharply in the second half, reflecting the easing of agricultural input prices (food commodities as well as agricultural production costs). Nonetheless, this does not mean that we anticipate a fall in the level of food prices: historically, rises in food commodity prices are passed through partially to final prices, while falls cause final prices to stop rising but not to actually decline.
Manufactured goods inflation is projected to moderate more rapidly – as of the fourth quarter of 2023 – reflecting marked year-on-year drops in industrial producer prices as of the fourth quarter of 2022 linked to steep falls in import prices.
In contrast, services inflation is expected to remain stickier owing to persistent wage pressures, especially with the upward revision of the SMIC (minimum wage) and rises in industry-level negotiated wages. The upward pressures should also be exacerbated by the expected recovery in profit margins in some sectors to close to their long-term average. As a result, services inflation is not projected to slow before the start of 2024.
In 2024, with the easing of energy and food commodity prices currently factored in by futures markets, all components of inflation should fall. The main driver of inflation should then be services prices (see Chart 5), which are expected to continue being supported – albeit to a gradually diminishing extent – by delayed hikes in wages and rents and the ongoing margin recovery expected in some sub-sectors. In annual average terms, headline inflation is seen falling to 2.4%, while inflation excluding energy and food should recede more slowly to 3.0%.
In 2025, headline inflation and inflation excluding energy and food should continue to decline, reaching 1.9% and 2.1% respectively in annual average terms. This reflects the dual impact of the ongoing normalisation of commodity prices (energy and food) and the gradual transmission of monetary policy tightening to core inflation. Services inflation in particular should start to slow, reflecting smaller nominal wage increases than in previous years, although real wages are forecast to remain fairly dynamic thanks to the moderation in headline inflation (see table page 7, “Change in real wages”).
After being supported by fiscal measures in 2022, household purchasing power should gradually be lifted by real wage growth against a backdrop of resilient employment
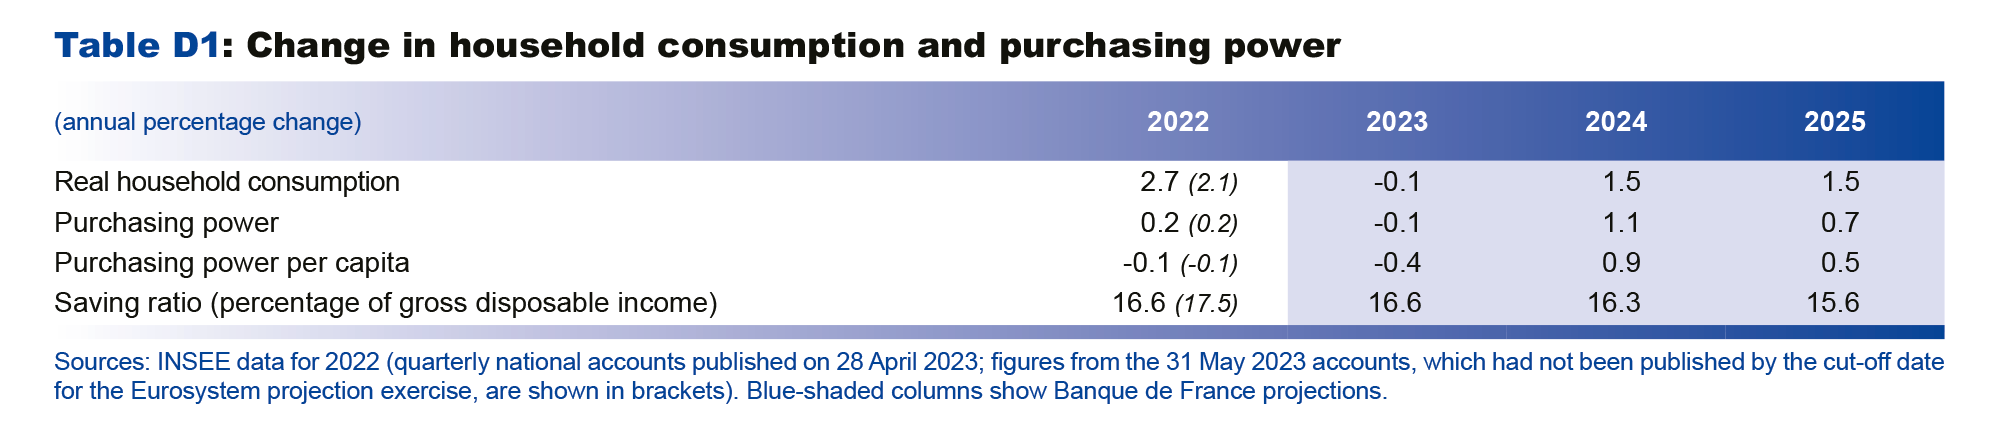
Purchasing power per capita, or real gross disposable income per capita, stagnated in 2022 (fall of 0.1%) and is expected to decline by 0.4% in 2023. The impact of the inflation shock on average purchasing power should be cushioned by a number of factors (see Chart 6). First, adjusted for the job retention scheme, the average wage per capita is expected to rise by 5.5% in 2023 compared with 3.8% growth in 2022. Second, strong employment growth, which provided marked support for purchasing power in 2022, should continue to make a slightly positive contribution in 2023. Finally, the fiscal measures and price shield should continue to support purchasing power, albeit to a lesser extent than in 2022. It is important to stress, however, that these macroeconomic forecasts relate to average purchasing power and may mask significant differences across household categories.


In 2024 and 2025, purchasing power per capita should start to pick up pace as inflation subsides: it is projected to rise by 0.9% in 2024 and by 0.5% in 2025, bringing it to a level 2.8% higher than before the Covid crisis in 2019.
The declines in purchasing power in 2022 and 2023 should have a temporary downward impact on household consumption, which is thus expected to edge down by 0.1% in 2023. Consumption should then accelerate in 2024, growing by 1.5%, and then rise at a similar pace in 2025 as economic activity and purchasing power recover.
After the historical highs observed in 2020 and 2021 with the restrictions on household consumption caused by the lockdowns, the household saving ratio began to fall in 2022. This decline should come to a halt in 2023 due to the strong uncertainty linked notably to the war in Ukraine, but the ratio is then projected to fall again gradually, reaching 15.6% in 2025 (see Chart 7), slightly above 2019’s level of 15.0%
Nominal wage growth should peak in 2023 but remain robust over the entire projection horizon. The corporate margin rate should fall slightly in 2023 and 2024, then pick up in 2025
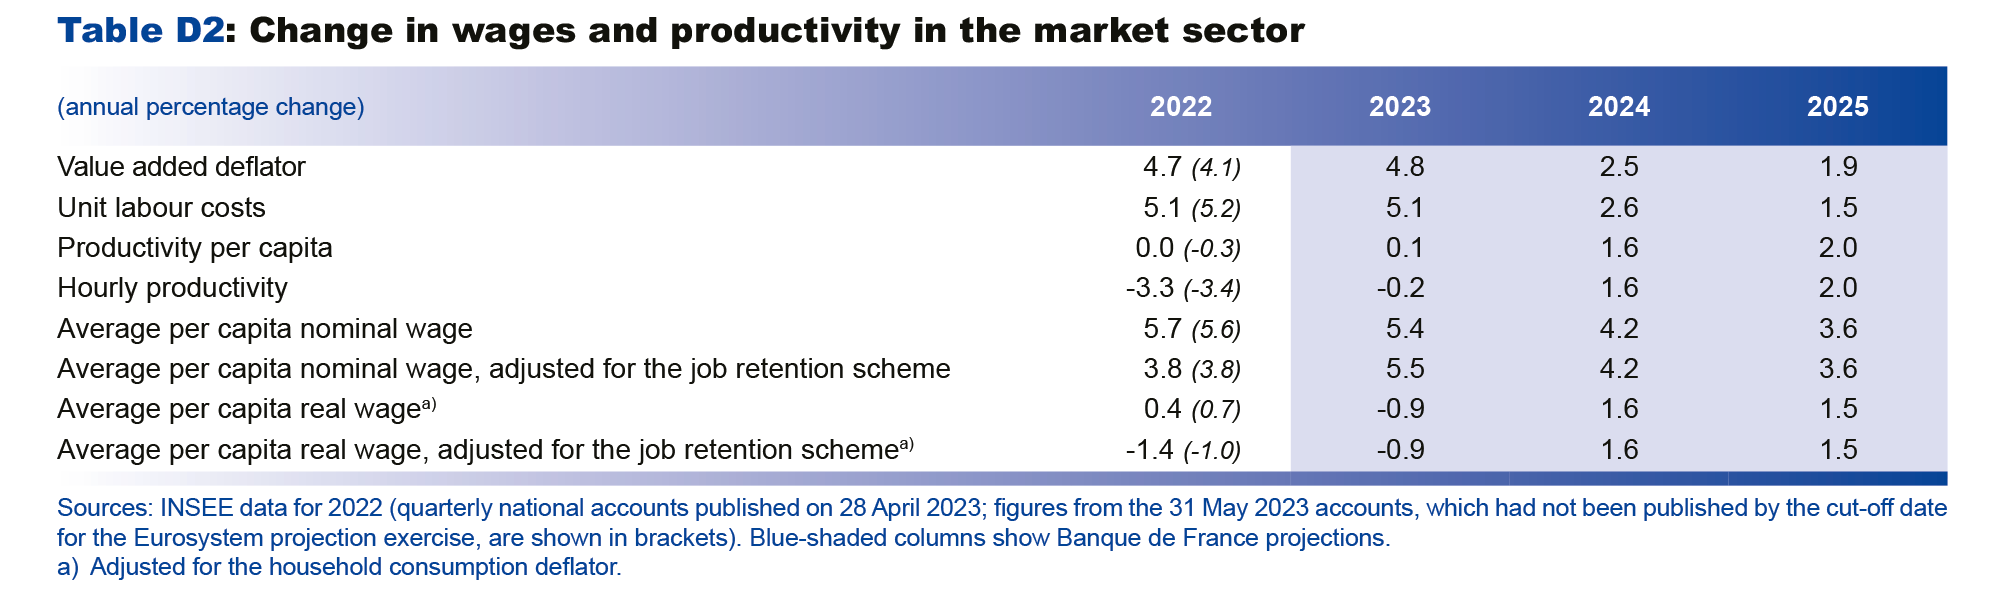
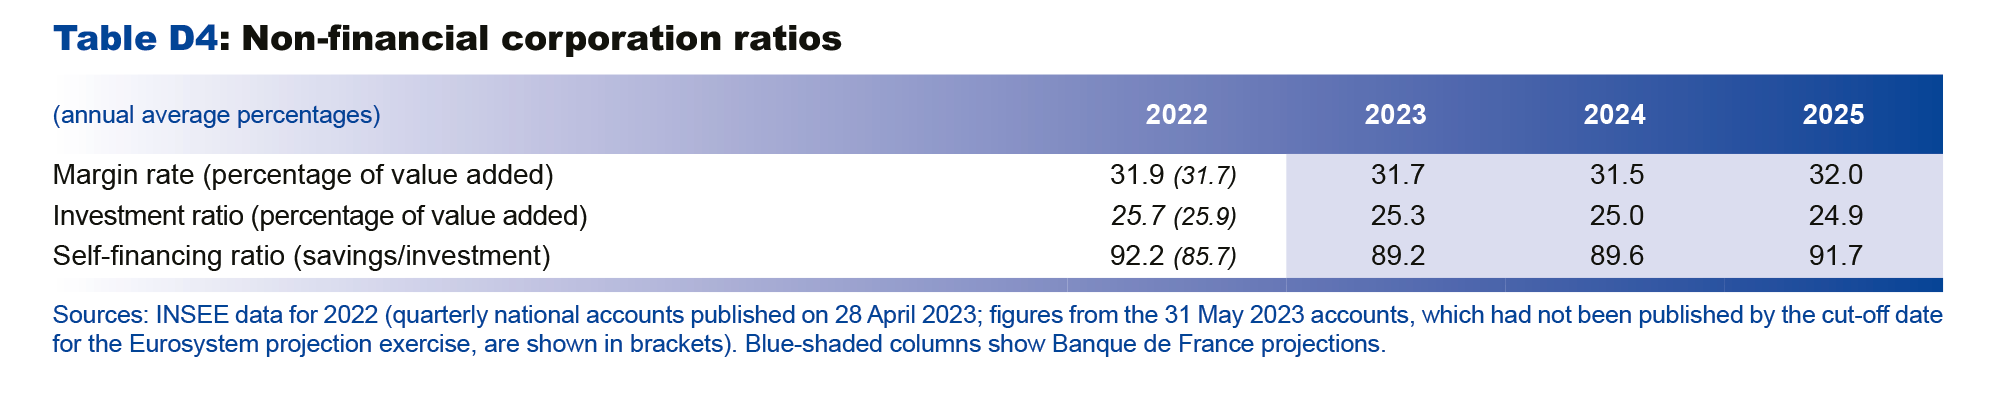
With the stagnation in productivity per capita, and despite more moderate growth in per capita wages, unit labour costs (ULCs, ratio of the cost of labour to labour productivity) rose markedly by around 5% in 2022 in the market sector. Businesses were also hit by rises in input costs caused by upward price pressures on energy and other commodities. They partially passed these higher costs through to selling prices (and hence to value added prices), helping to limit the decline in the aggregate non-financial corporation (NFC) margin rate in 2022 compared with 2021’s record level: last year it came back to around its pre-Covid level (see Chart 8).


With regard to wages, the private sector monthly base wage, an index published by the Ministry of Labour’s research and statistics directorate, DARES, and which reflects the underlying trend in wages excluding bonuses, was up 4.6% year-on-year in the first quarter of 2023, after 3.9% growth in the fourth quarter of 2022. The higher rate of growth in the average per capita wage in 2022 notably reflects the payment of large one-off bonuses called primes de partage de la valeur (PPV – value-sharing bonus), which replaced the prime exceptionnelle de pouvoir d’achat (PEPA – exceptional purchasing power bonus). According to INSEE estimates, in non-farm market sectors, the PPV contributed around 1.5 percentage points to the year-on-year rise in the average per capita wage (around 5.0%) in the fourth quarter of 2022. In 2023, we expect PPV payments to remain high and, alongside seniority-based and individual pay rises as well as staff turnover, they should help to maintain the gap seen recently between year-on-year growth in the average per capita wage and the monthly base wage (see Chart 9).
In 2023, 2024 and 2025, with inflation retreating but the labour market remaining tight, the average per capita wage (corrected for the job retention scheme) is projected to rise by 5.5%, 4.2% and 3.6% respectively (with a peak in the third quarter of 2023 at 6.2% year-on-year). This comes after the 3.8% growth observed in 2022. From employees’ perspective, therefore, the average real wage per capita (average wage per capita adjusted for the household consumption deflator; see table) should rise fairly markedly in 2024 and 2025, after declining in 2022-23.

From businesses’ perspective, the market sector average per capita wage should again grow faster than the value added deflator, and real wages (“from the producer’s perspective”, i.e. adjusted for the value added deflator) should start to rise again as of 2023 (see table) after the cumulative contraction observed from 2020 to 2022. However, the impact of strong ULC growth on NFC margins should be mitigated by the abolishment of the cotisation sur la valeur ajoutée des entreprises (CVAE – corporate value added contribution). Moreover, businesses are expected to adjust their headcount while economic activity recovers, and productivity should start to rise again as of 2024.
As a result, the margin rate is only forecast to decrease slightly to 31.5% in 2024. In 2025, as economic activity continues to recover and productivity growth outstrips real wage growth, the margin rate should increase again to 32.0%, slightly above 2018’s level (2018 is used as the reference point for the pre-Covid period as 2019 was impacted by the double-counting of the Tax Credit for Competitiveness and Employment or CICE).
With the tightening of financing conditions necessary to curb inflation, we expect private investment to dip temporarily
In France as in the rest of the euro area, bank lending conditions have normalised since the end of 2022. The effect of tighter bank lending conditions on household and business investment, on top of that of higher interest rates, is not always fully captured by forecasting models. We quantified this effect using alternative models that incorporate greater interaction between macroeconomic, financial and banking variables. In France, we estimate that financing conditions will have a moderate additional impact of around -0.1 percentage point on GDP growth each year over the projection horizon, principally via their effect on private investment.
As a result, we have revised down our forecast for the volume of business investment over the entire projection horizon. We still expect it to remain fairly resilient, however, thanks to relatively robust corporate margins and strong growth in intangible investment linked to the digital transition. At the end of 2025, the volume of business investment should still be 10% higher than before the Covid crisis. Regarding household investment, after reaching a high in 2021-22, it has since begun to fall, and is projected to remain on a downward path with the normalisation of financing conditions, before stabilising by the end of 2024.
After the slowdown in activity, the unemployment rate should rise slightly in 2024 and 2025 from its current historical low. However, the scale of this rise has been dampened substantially since our previous projections.
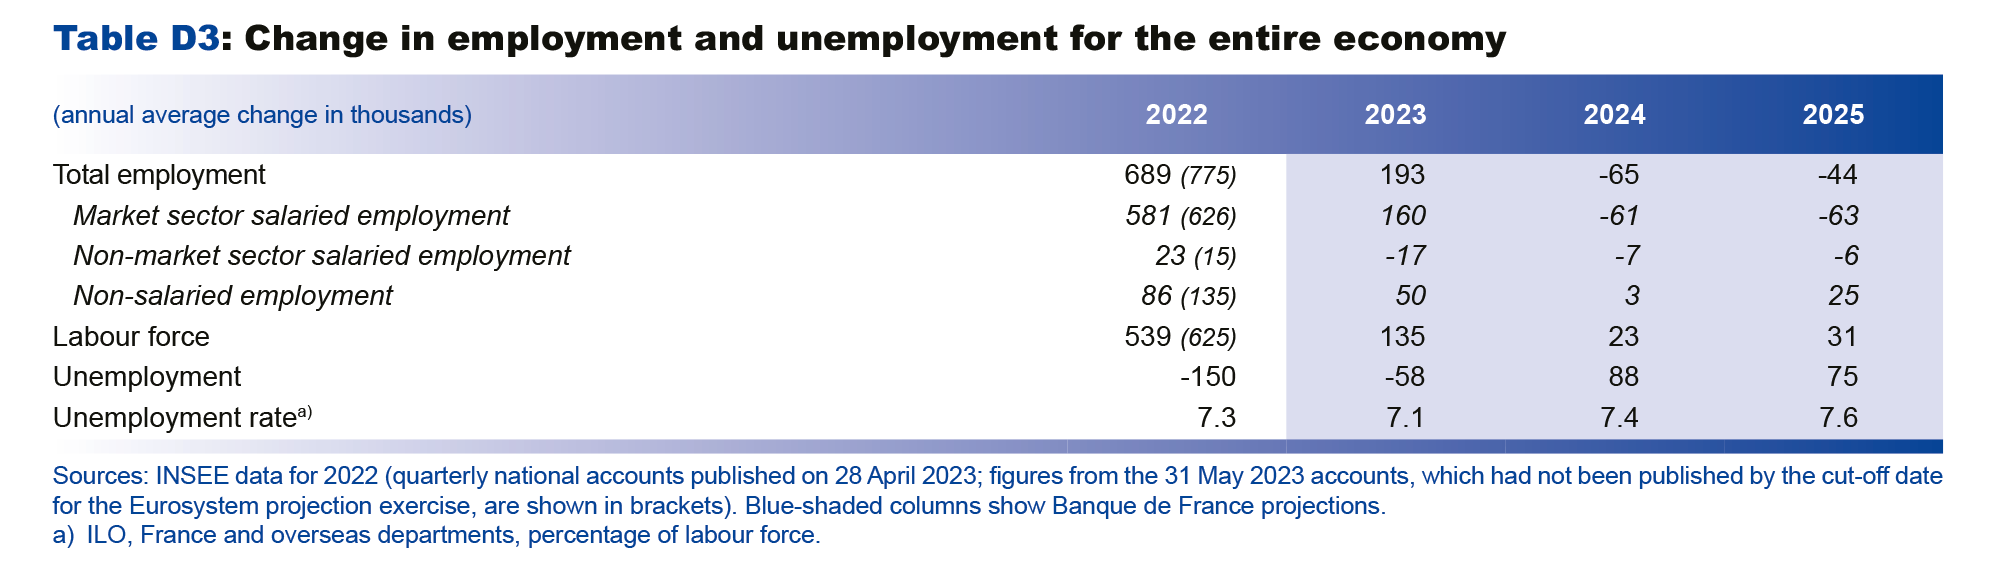
Net job creations slowed sharply in the final quarter of 2022 compared with the previous quarter and, in our March projections, we forecast that this trend would continue; however, private sector salaried employment in fact rose by 42,000 jobs in the first quarter of 2023. In the second quarter, based on available short-term indicators (business surveys, hiring intentions), we anticipate that employment growth will continue, albeit more slowly, with half as many job creations as in the first quarter.
Over the rest of our projection horizon, a number of factors have prompted us to revise our employment forecast upwards significantly since March and our unemployment rate forecast downwards. While we still anticipate a cyclical weakening in employment, we now expect it to be more moderate than previously anticipated.
Our past projections were based on a fairly rapid closing of the labour productivity cycle (i.e. of the gap between labour productivity and its medium/long-term trend), but recent data suggest that this process has not yet started. We have therefore slowed down the rate at which we expect the labour productivity gap to close (see Chart 10). For a number of years, two types of factors – temporary and lasting – have been dragging on labour productivity. We are maintaining our March assessment that the lasting factors account for around half of the productivity losses observed since end-2022, although this appraisal is surrounded in significant uncertainty, as illustrated by the alternative scenarios in our last publication. But following the positive surprises in market sector employment compared with our past projections, we now expect the productivity cycle to close over three years rather than the two previously anticipated in March. Growth in productivity per capita is thus projected to be close to zero in 2023 as employment and activity remain similarly robust; it should then accelerate to 1.6% in 2024 and 2.0% in 2025. The productivity cycle is then expected to close gradually as of 2024; it should still be slightly negative in 2025, and then close completely in 2026. This implies stronger market sector salaried employment growth over the next few years than in our March projection.


Our forecast then incorporates, for the first time, the effects of the pension reform. This will ramp up as of September 2023, boosting the labour force, which will in turn be gradually passed through to employment.
We have also revised two other specific factors compared with March. We have raised our forecast for market sector non-salaried employment to reflect the high number of micro-enterprises created these past years. We have also revised up our forecast for non-market sector salaried employment to take better account of its past correlation with public sector employment.
Overall, in 2023, we expect employment growth to slow (160,000 net salaried job creations after 581,000 in 2022), but to a lesser extent than anticipated in March (when we forecast 53,000 net job creations). In 2024 and 2025, market sector salaried employment should fall slightly amid the slowdown in activity and partial recovery
in productivity.
The unemployment rate is seen stabilising in 2023 at around 7.1%, and then rising moderately in 2024 (7.4%) and 2025 (7.6%, half a percentage point below our previous forecasts; see Chart 11).
At constant legislation, the government deficit should decrease over the projection horizon while remaining above 4% of GDP, and the government debt-to-GDP ratio is not expected to decline
The forecasts given here do not incorporate the expenditure reduction measures announced by the Minister of the Economy and Finance ahead of the “Assises des Finances Publiques” conference on 19 June.
In 2023, there is a risk that the government deficit could exceed 5% of GDP again (after 4.7% in 2022), despite the scaling back of emergency support measures and the stabilisation of the net cost of the price shield. In our projection, this widening in 2023 is essentially seen stemming from the normalisation of the revenue windfalls seen in 2022 and, to a lesser extent, from the delayed impact of past high inflation on government expenditure. The ratio of government revenue to GDP is expected to fall by 1 percentage point in 2023, although this will be partially offset by a 0.5 percentage point decline in the ratio of expenditure to GDP. On the revenue side, the gradual normalisation of corporation tax and abolition over a two year period of the cotisation sur la valeur ajoutée des entreprises (CVAE – corporate value added contribution), should shave 0.5 percentage point off the tax-to-GDP ratio. Other revenues should fall to a similar extent, notably due to a reduction in support from the European fund for the recovery plan. In parallel, the expenditure ratio is projected to decrease by 0.5 percentage point due to the end of the public health crisis measures and recovery plan, even though they are partially being replaced by new measures such as France 2030, the green fund and support for apprenticeships. The delayed impact of the inflation surge in 2022 should increase government expenditure slightly, excluding discretionary fiscal consolidation measures. The debt interest burden in particular is predicted to remain fairly stable versus 2022 as a percentage of GDP, as the impact of higher interest rates this year should be offset by a decline in the inflation benchmarks to which France’s indexed debt
is tied.
In 2024-25, at constant legislation, the government deficit is forecast to narrow, reaching 4.5% of GDP at the end of the projection horizon. This gradual decline should be driven by the fall in the expenditure ratio coupled with a stabilisation of the revenue ratio. The expenditure ratio should fall by around 1 percentage point, driven by the lifting of the price shield and by both the pension and unemployment insurance reforms. The tax-to-GDP ratio is projected to remain stable, as the elasticity of taxes and social security contributions to GDP is equal to unity. At the end of the projection horizon, it should be close to its pre-Covid level (44.7% of GDP in 2019 excluding the double-counting of the CICE), whereas the expenditure ratio should be around 2 percentage points higher than in 2019.
A third of this rise should be due to the increase in the debt burden, and the remaining two-thirds to an increase in primary expenditure. This lasting growth in primary expenditure is attributable to the measures currently in force (France 2030, support for apprenticeships, reform of technical colleges), and to the fact that, at constant nominal expenditure, the expenditure ratio will be impacted by a denominator effect caused by the lasting loss of potential GDP. These factors should only be partially offset by the pension and unemployment insurance reforms, which will continue to ramp up after 2025.
The government debt-to-GDP ratio is not expected to shrink and should remain close to 111% over the entire projection horizon (see Chart 12). After rising more than in the euro area during the Covid crisis (+15 GDP points between 2019 and 2021 compared with +11 points in the overall euro area), France’s debt-to-GDP ratio is only seen declining by 1 percentage point by 2025 from its 2021 peak, compared with a drop of 8 percentage points for the euro area as a whole (to 87% of GDP in 2025, according to Eurosystem projections), which will wipe out nearly all of the previous rise. This should lead to a lasting widening of the gap between France and the euro area.

There are still numerous risks to activity and inflation, but they are overall balanced
The negative risks tied to possible energy supply cut-offs and their potential effects on activity did not materialise in winter 2022-23. However, there are still uncertainties over how the geopolitical situation will evolve with Russia’s war in Ukraine, raising the possibility of energy supply difficulties in winter 2023-24 that would pose an upside risk to inflation and downside risk to growth. More generally, the geopolitical context as a whole poses a risk to France’s commodity import prices.
Regarding foreign demand, China’s recovery is currently proving sluggish, but if the pace picks up and spreads to the rest of Asia, it could support activity by boosting foreign demand and reducing supply difficulties. Conversely, a recession in the United States cannot be completely ruled out over the projection horizon, especially if inflation proves more persistent than expected. Regarding domestic demand in France, a more marked decline in the household saving ratio, which is seen remaining high over our projection horizon, could provide greater support to consumption and hence to GDP growth.
Regarding the domestic factors affecting inflation, there are also upside and downside risks. Inflation excluding energy and food could prove stickier than expected, especially in the case of stronger and more persistent wage rises. However, monetary policy could also have a stronger or more rapid impact on inflation than currently factored into our projections.
Box
The latest national accounts, published after the closure of the Eurosystem’s macroeconomic projection exercise, confirm GDP growth of 0.2% for the first quarter of 2023 but revise the household saving ratio upwards
On 31 May 2023, INSEE published the second estimate (known as the “detailed figures”) of its first quarter 2023 national accounts. Given the cut-off date for our macroeconomic projection exercise, these detailed figures could not be incorporated into our
new forecasts.
First quarter 2023 GDP growth was confirmed at 0.2% while annual GDP growth for 2022 was revised slightly downwards to 2.5%, from 2.6% in the quarterly account first estimate published on 28 April 2023. The growth carry-over for 2023 remained unchanged at the end of the first quarter at 0.4%. Our GDP growth forecast for 2023, which incorporates INSEE’s first estimates, is therefore unaffected by the changes in the detailed figures.
The composition of growth, however, has been revised.
- Overall, domestic demand makes a negative 0.2 percentage point contribution to growth for the quarter, revised downwards by 0.1 percentage point from the first estimate. This is mainly related to investment, which was revised sharply downwards to -0.8% (from -0.2% in the first estimate).
- Conversely, the positive contribution to growth made by external trade was revised upwards to 1.0 percentage point (compared with 0.6 percentage point in the first estimate), due to a far sharper slowdown in imports (a drop of 2.8% compared with a 0.6% decline in the first estimate) than in exports (down 0.2% rather than a 1.1% increase).
- Lastly, the contribution to growth from inventories was revised downwards (a negative contribution of 0.6 percentage point rather than 0.3 percentage point), mainly due to the destocking of other industrial products and of crude oil, as a result of refinery strikes.
The second estimate also provides preliminary data on household and enterprise accounts. Although trends in employment, household income and the non-financial corporation margin rate remain broadly in line with our expectations, the household saving ratio for the first quarter of 2023 was much higher than anticipated, at 18.3% rather than 16.6%. In addition to a sharp upward revision at the end of 2022 (up 1.1 percentage point to 18.7%), the decline in the first quarter 2023 saving ratio of 0.4 percentage point was more limited than that incorporated into our forecasts (a drop of 1.0 percentage point) due to stronger-than-expected growth in real incomes. This initial savings surplus dampens growth in household consumption in the short term, but could create leeway for greater growth in the medium term.
Appendices
Consult
Download the document
Updated on the 25th of July 2024