In order to contribute to the national and European economic debate, the Banque de France periodically publishes macroeconomic forecasts for France, constructed as part of the Eurosystem projection exercise and covering the current and two forthcoming years. Each publication comprises a summary of the projections. Some also include an in-depth analysis of the results, along with focus articles on topics of interest.
Introduction
• After dropping markedly in 2020, French economic activity is experiencing a strong rebound in 2021. Following a start to the year marked by ongoing public health restrictions, the phased lifting of the lockdown and acceleration of the vaccination campaign should allow the economy to recover in earnest in the second half. According to our economic surveys, economic activity started to recoup lost ground in the second quarter, despite the emergence of supply difficulties in certain sectors. It should rebound particularly strongly in the third and fourth quarters, as the gradual easing of the public health restrictions leads to strong household consumption growth.
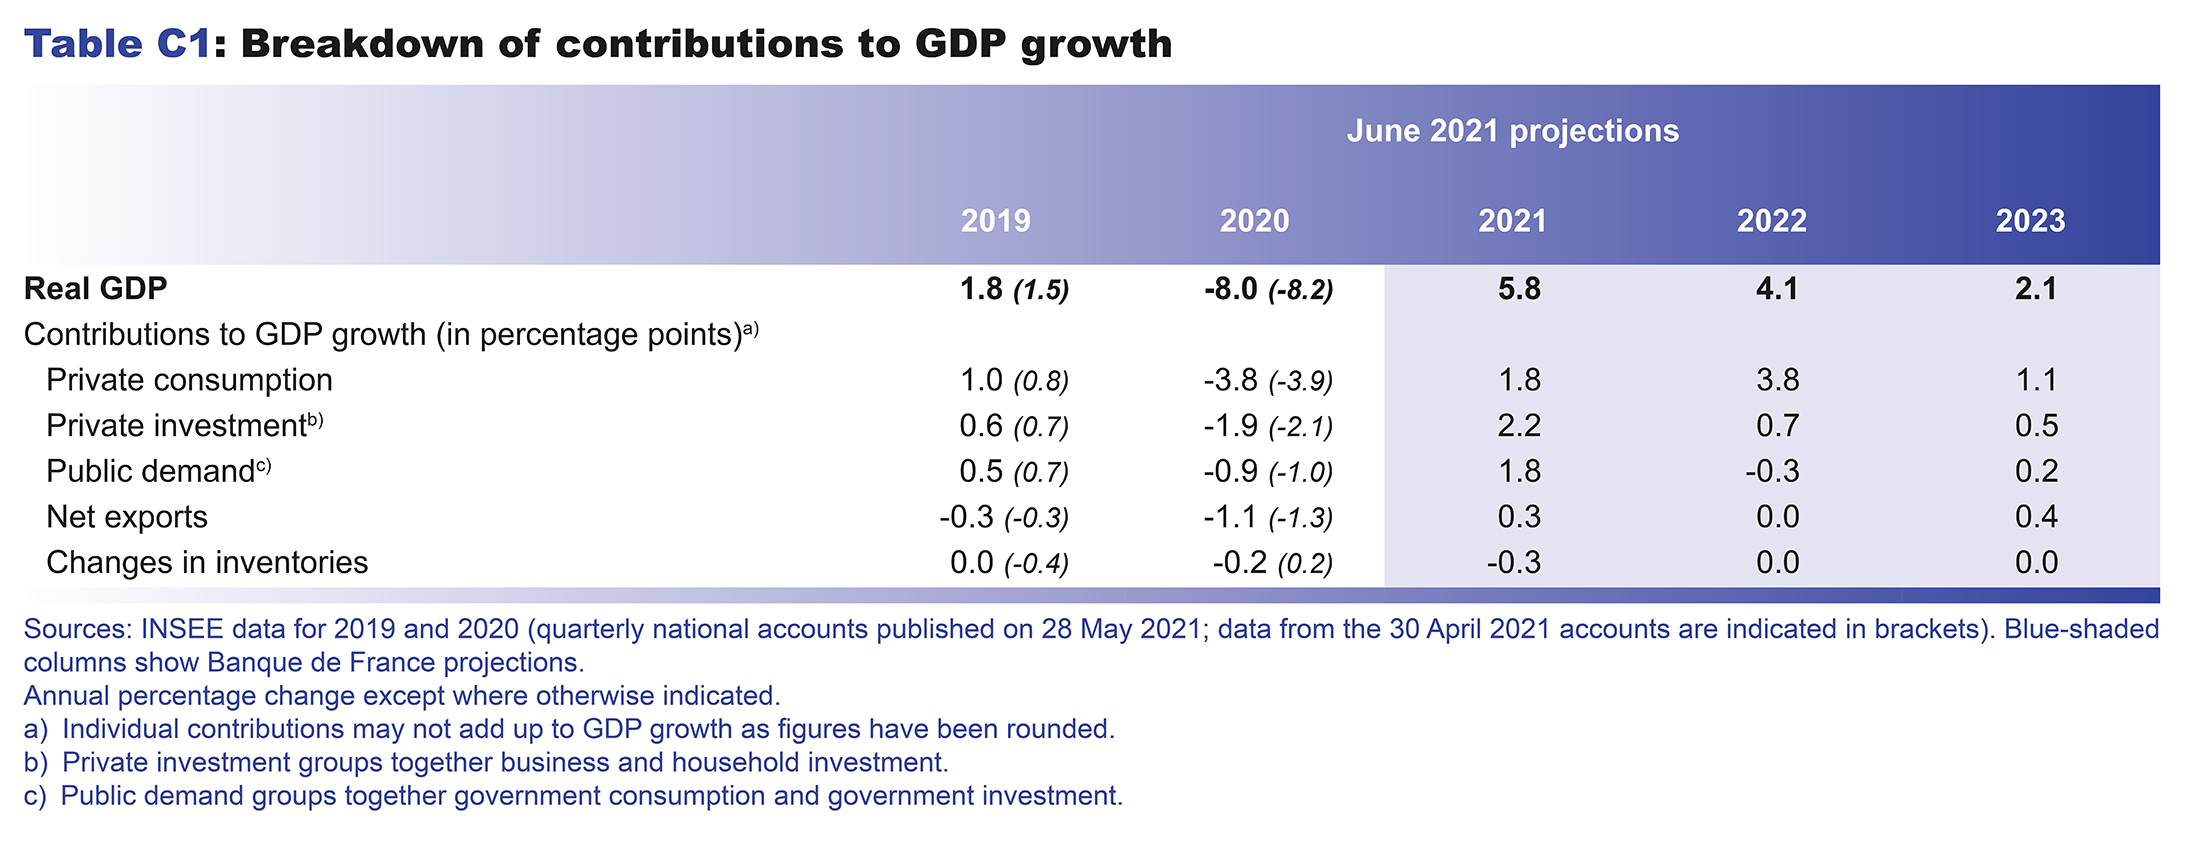
• In 2021, GDP is projected to expand by 5¾% in annual average terms (which is higher than the euro area average of 4.6%). It should then grow by 4% in 2022 and by 2% in 2023. This scenario results in a higher medium-term level of GDP than in our March projections, as the productivity losses linked to the crisis are now seen as being much smaller than we originally estimated.
• Headline inflation is expected to average 1.5% in 2021, although it should prove volatile over the year, with the annual rate fluctuating between 0.8% and 2.1%. Underlying inflation should see some upward pressure in 2021 and 2022, especially as higher input prices feed into manufactured goods prices. But it should still be kept in check by moderate wage growth. Despite some temporary fluctuations, headline inflation should ultimately remain at around 1.2% in 2023. The risks to inflation are tilted to the upside.
• Activity should start to exceed pre-Covid levels as of the first quarter of 2022, which is one quarter earlier than foreseen in our March projections. The strong GDP growth should essentially be driven by domestic demand in 2021 and 2022, both from consumption and investment. Household purchasing power was on the whole preserved in 2020, and should start to rise again in 2021 and 2022. Household consumption and investment spending are expected to accelerate further in 2022 thanks to the excess savings accumulated previously. Investment in particular should be very robust in 2021 and 2022, as households catch up on projects that were put off during the crisis. Regarding businesses, their margin rate should return to pre-Covid levels in 2021, and their investment ratio should reach historical highs after proving fairly resilient during the 2020 recession.
• Aside from the public health risks, there are two major uncertainties that could impact these projections during the rebound period: first, how fast and to what extent households spend their excess financial savings; second, the extent and duration of the tensions in global input prices and a possible increase in hiring difficulties.
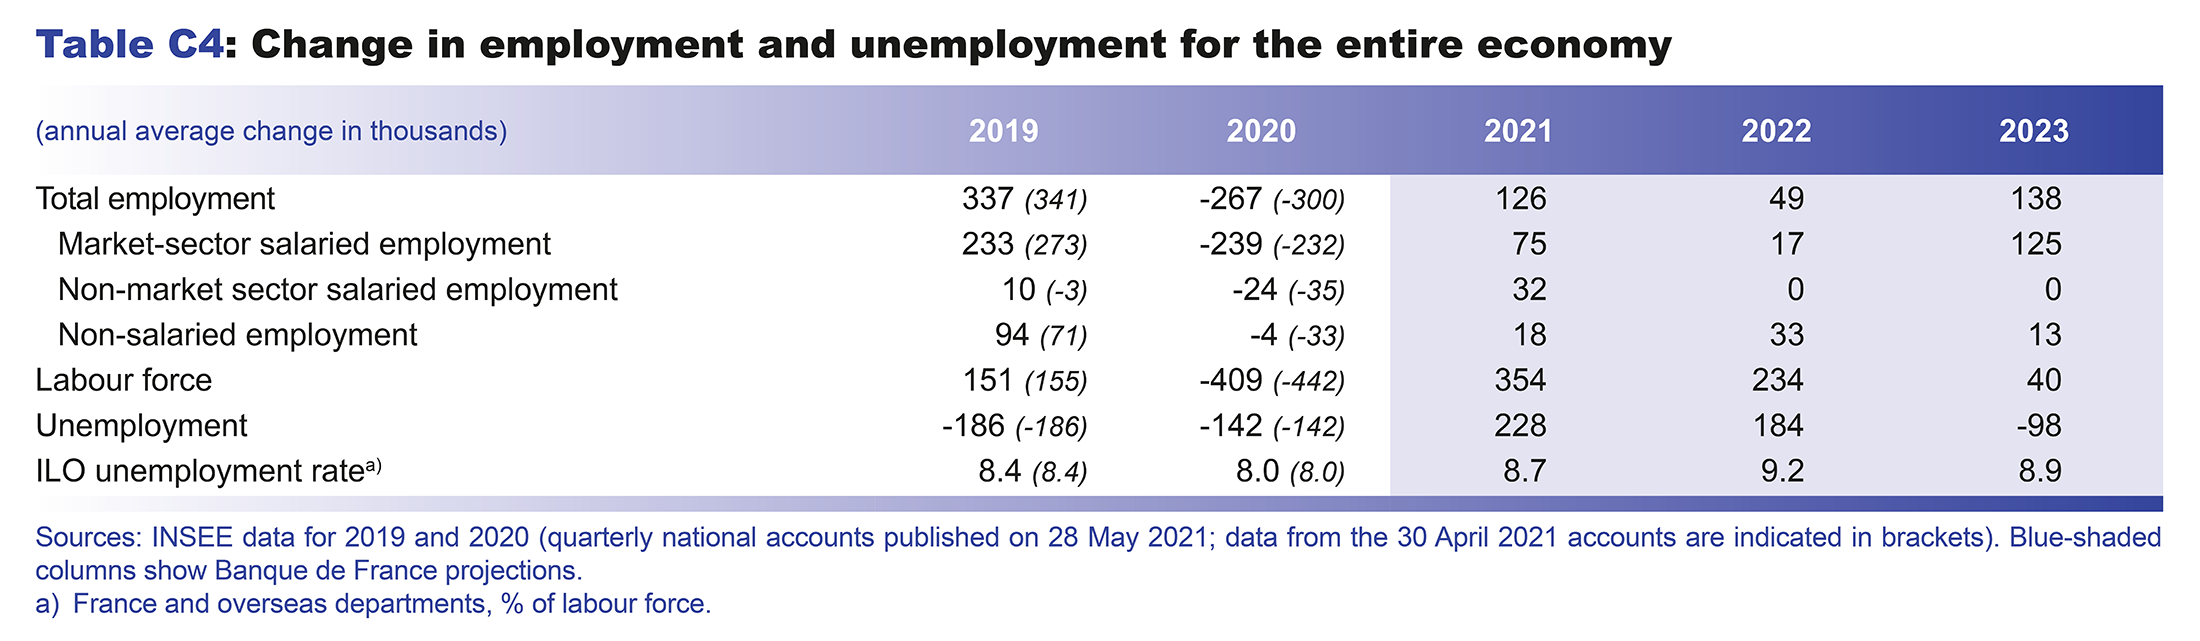
• The employment market is expected to confirm its resilience, thanks to the emergency measures introduced to stave off job destructions in the midst of the crisis, and to fairly robust net job creations between 2021 and 2023. With the labour force returning rapidly to its pre-crisis trend, the unemployment rate should reach 9.3% in the first half of 2022, before easing back to well below 9% by 2023.

After remaining constrained by the measures to control the pandemic in the first half of 2021, economic activity should rebound sharply in the third and fourth quarters of 2021
Economic activity stabilised in the first quarter of 2021, after declining in the fourth quarter of 2020 with the introduction of the second lockdown in November (our projection incorporates the preliminary national accounts for the first quarter of 2021, which were published by INSEE on 30 April 2021; although first quarter growth was indeed revised downwards−from 0.4% to –0.1%−in the detailed first quarter 2021 accounts which were published on 28 May, at the same time as the full-year 2020 accounts, annual growth for 2020 was revised upwards−from −8.2% in the 30 April accounts to – 8.0%, adjusted for seasonal and working day variations; as a result, the level of GDP for the first quarter of 2021 is still broadly in line with the starting point for our projections; the publication of 28 May 2021 therefore more or less corroborates our forecast for the trajectory of GDP in 2021). Our economic growth projections for 2021-23 are based on a number of assumptions. First, the assumptions on the international and financial environment, for which the cut-off date is 18 May (see Table A in the appendix), are those used in the Eurosystem projections for the entire euro area. Foreign demand for French goods and services has been revised upwards compared with our March projections, but the positive effect of this on growth is expected to be dampened by higher oil and commodity prices. Second, the economic outlook in all countries remains contingent on the evolution of the pandemic, and especially on the pace of the vaccination programme which will determine when the lockdown measures are lifted. We assume that the acceleration of the vaccination campaign in France, and the efficacy of the vaccines against the different variants, will allow the government to continue the easing of the lockdown which began in May 2021. Third, a draft supplementary budget law was announced after these projections were finalised; the proposed measures should facilitate the transition to a sustainable recovery.
In the second quarter of 2021, according to the Banque de France’s latest economic survey, the third lockdown is mainly expected to have affected activity in the retail and transport services sectors. Supply constraints have begun to emerge in certain sectors, but at this stage business leaders do not expect them to restrict output in the event of a rise in demand. Household consumption declined in April, as in the previous lockdown in November 2020, albeit to a much lesser degree. However, activity continued to be buoyed by a dynamic pace of private investment, by both households and firms. Overall, GDP is expected to have risen slightly in the second quarter.
As of the third quarter of 2021, activity is predicted to rebound sharply, driven by household consumption, thanks to the significant improvement in the health situation. The upturn should then continue over the final months of the year, and GDP is forecast to rise by 5¾% over the full year 2021 (see Chart 1). Activity should start to exceed its pre-crisis level at the start of 2022, and GDP should expand sharply over the year (4% growth), driven essentially by household consumption and investment spending and by the continued improvement in the international environment. In 2023, the pace of activity growth should begin to normalise, but is nonetheless expected to remain robust (at 2%).

Overall, we have revised the expected level of activity for 2023 upwards compared with our March forecast (see Chart 2), and now anticipate a more limited loss of potential GDP than before. The fact that public policies have helped to avert a wave of bankruptcies and redundancies, that the loss of activity has been concentrated in a small number of sectors (retail, accommodation and food services, etc.), most of which are expected to recover, and that the financial system has been left unscathed, all suggest that the lasting productivity losses will be smaller than predicted in our previous publications, and than observed in the 2008-09 financial crisis. In the long term, the losses should be in the level of productivity, not in its rate of growth. By 2023, therefore, potential growth should return to a similar pace as that predicted before the health crisis.


On average over 2021, the GDP growth of 5¾% should be driven by a sharp rebound in private and government investment, combined with strong exports and government consumption (see Chart 3). The positive trend in household consumption, as of the second half of 2021, should mainly impact annual average growth in 2022. The strong contribution of public demand to growth in 2021 should stem from the combined effect of a normalisation of public sector activity and the first impacts of the recovery plan.
Thanks to the measures to preserve their income, household consumption and investment spending should rebound as of the second half of 2021
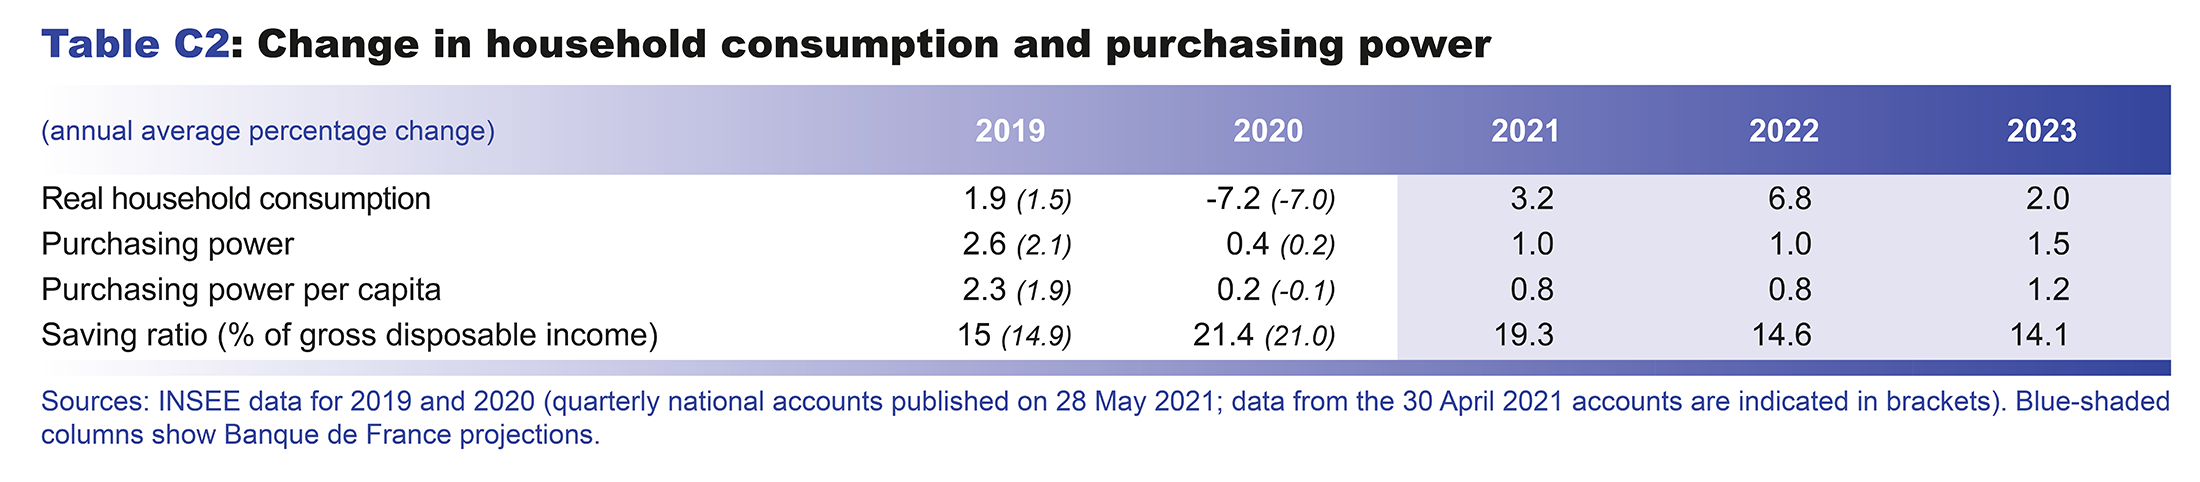
At the aggregate level, in 2020, the government cushioning mechanisms helped to keep the labour market resilient and preserve household purchasing power (see Chart 4 below), although this of course masks considerable differences in situations depending on the household category. From 2021 to 2023, real household income is forecast to rise as the economic situation improves, with the growth driven mainly by labour income.


This resilience in income should allow household consumption and investment spending to rebound sharply as of the second half of 2021. First, household consumption is forecast to rise markedly, and the household saving ratio should decline from 22% in the second quarter of 2021 to 17% in the final quarter of the year, and then to below its 2019 level in 2022 and 2023. Households should thus make up for some of their under-consumption in 2020 and 2021. Second, even though the first quarter was ultimately slightly disappointing in the detailed GDP figures published by INSEE on 28 May, short-term indicators in the construction sector (housing permits, outlook for activity, etc.) suggest household investment will be dynamic in coming quarters. Households should thus completely make up for their under-investment in 2020 and 2021. This favourable scenario is supported by the strong economic outlook, the low level of interest rates and the excess savings accumulated during the crisis.
These excess savings stem essentially from the low level of household consumption during the crisis, and from the decline in household investment (see chart in Box 1 below). After reaching EUR 115 billion at the end of 2020, the financial savings excess is expected to rise at a more moderate pace in 2021, thanks to the fall in the household saving ratio (see Chart 5), and should peak at up to EUR 180 billion at end-2021. The financial saving ratio should then fall further in 2022 and 2023, and has been revised downwards compared with our March forecast. This should enable households to spend about 20% of the excess accumulated at end-2021. Box 1 describes this trend in greater detail and presents alternatives to our baseline scenario, showing the impact on activity if the savings excess is used to an even greater extent.
Box 1 : The use in 2022-23 of the excess savings built up by households in 2020-21 is a determinant of the pace of recovery
Since March 2020, households have built up a large amount of excess financial savings as a result of restrictions on consumption and investment. Excess financial savings are measured as the cumulative difference between observed or projected financial savings for each quarter and the level that would have been reached if household income and expenditure had continued to rise since end-2019 at the rate observed before the crisis. Household investment here refers to purchases of new housing and renovation expenditure but excludes purchases of existing housing, which are financial transactions between households and have no impact on their aggregate expenditure in national accounts.
Measured as a deviation from a non-crisis trend, these excess savings amounted to EUR 115 billion at end-2020 and are expected to continue rising to reach a peak of EUR 180 billion at end-2021. We break down (see chart) the excess financial savings into a consumption component and an investment component. The contribution of consumption (respectively investment) to these excess savings is estimated by comparing their observed and then projected trajectory to a counterfactual scenario where the household saving ratio (respectively the investment ratio) remains at its pre-crisis, fourth quarter 2019 level. According to this approach, the excess financial savings are mostly linked to under-consumption in 2020 and 2021 (to the tune of around 90%), with under-investment in 2020 accounting for around 10% of the excess financial savings.
With the rebound in household consumption, expected from the third quarter of 2021, and in household investment, the cumulative excess financial savings are expected to decline by about 20% in 2022-23 compared with their end-2021 peak. This baseline scenario is more favourable than that of our March forecast. In particular, household investment has been revised upwards significantly, based on the strength of recent economic indicators (housing starts and surveys in the construction and property development sectors). In addition, the distribution of the excess savings, which is weighted more towards the wealthiest households whose propensity to consume is rather low, could also support investment. All in all, in our baseline scenario, this translates into a full use of the component of the excess savings linked to 2020’s under-investment by 2023.
As this baseline scenario is characterised by a high degree of uncertainty about households’ propensity to spend the excess savings, our forecast is accompanied by two alternative scenarios. In these alternative scenarios, spending of the cumulative excess savings at end-2021 is twice as high (approximately 40%). We assume that this additional spending occurs only through consumption in the first scenario, and only through household investment in the second scenario.
In both cases, a two-fold increase in the use of excess financial savings would thus lead to a cumulative amount of additional GDP of around 0.3% over the 2021-23 period, with a concentrated effect during the period in which the additional spending occurs. GDP is temporarily higher when assumptions about household demand in the rebound period are more favourable. However, this demand is not permanently higher and occurs mainly during the “overspending” period, so that the level of activity in the medium term remains unchanged and GDP then returns to the level of the baseline projection in the scenarios studied.
These two scenarios nevertheless require that household behaviour be fairly atypical compared with historical trends. The first scenario assumes that the household saving ratio will sink to a level not seen since the 1990s, reaching a low point of around 13% in 2022. Such a level of consumption could come up against supply constraints and lead to a rise in imports. The second scenario assumes that the household investment ratio will reach its highest level in forty years, at nearly 10.5% of household disposable income, exceeding that seen in the 2006-07 boom. This investment ratio could also come up against supply constraints in the construction sector.
Based on the resilience of corporate margins, the corporate investment ratio should stabilise at a high level over the projection horizon
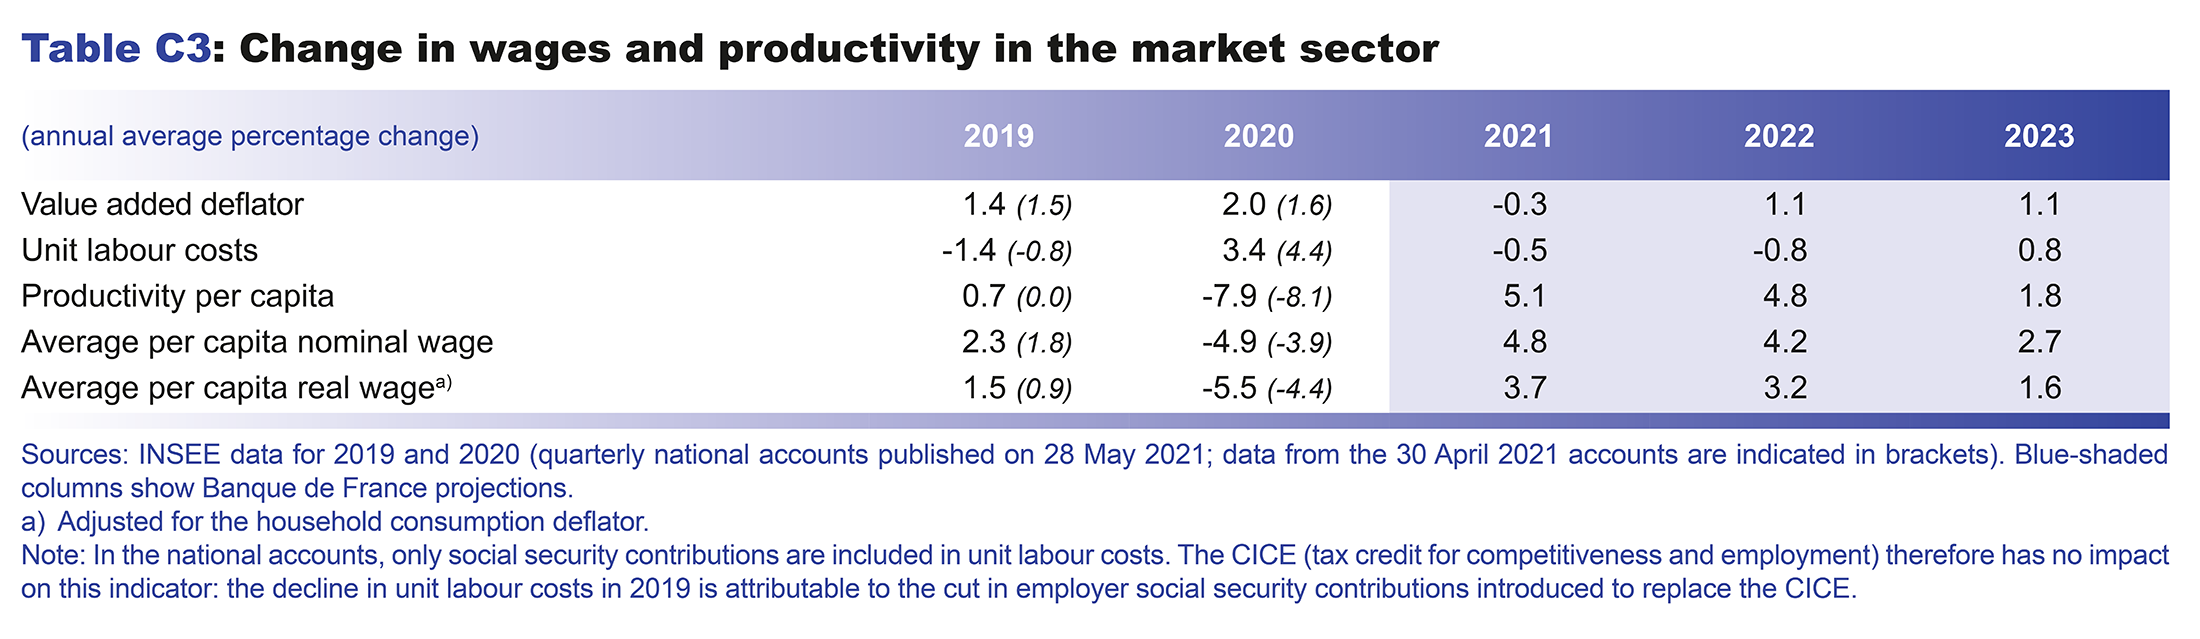
After remaining stable in 2020 (excluding the effect of the CICE, a tax credit for competitiveness and employment), the corporate margin rate is seen improving sharply in 2021 and should remain relatively high over the rest of the projection horizon (see Table 1). In 2023 it should come back to near its end-2019 level, while the wage-bill-to-GDP ratio should also be similar to that seen in pre-crisis years. The corporate margin rate should also be buoyed by the aid measures included in the recovery plan, such as the investment and hiring subsidies, and the cuts to production taxes.

The positive trend in margins is expected to buoy business investment. It already proved remarkably resilient at the height of the crisis, thanks notably to favourable financing conditions, the fact that business leaders regarded the crisis as temporary, and significant IT hardware and software purchases. The non-financial corporation investment ratio is therefore expected to peak in the first half of 2021 before gradually normalising, but it should remain above its pre-crisis level for the rest of the projection horizon (see Chart 6 above).

Exports should rebound vigorously thanks to the recovery in global trade and the start of a return to normal in the sectors worst-hit by the crisis
After weakening considerably in 2020, exports are expected to benefit from both the recovery in global trade, and the start of a return to normal in tourism and aeronautics, France’s stronghold export sectors. However, France’s export performances, measured as the ratio of exports to foreign demand, are projected to remain below the levels seen in 2019, mainly due to persistent weakness in the aeronautics and business travel sectors. In 2021, stronger foreign demand for French goods and services and the stabilisation of French export performances should mean net trade makes a positive contribution to growth (+0.3 percentage point) after the strong negative impact seen in 2020. The contribution should then become negligible temporarily in 2022 as imports spike amidst the ongoing domestic demand recovery. However, it should turn firmly positive again in 2023 (+0.4 percentage point), based on our baseline assumption of a partial return to normal in aeronautics and tourism.
There are still several risks to our activity projections, linked to both the health situation and macroeconomic environment, but they are becoming more balanced
With regard to GDP, the risks are balanced. The projections are, of course, strongly contingent on the evolution of the health situation in France and the rest of the world. On the upside, activity could prove stronger than expected once the health restrictions are lifted, as was the case in the summer of 2020, especially if there is a synchronous strengthening in the global recovery. On the downside, however, the possible emergence of vaccine-resistant strains of the virus could lead to the reintroduction of restrictions, which would curtail activity. At the domestic level, financial pressures for certain firms might lead them to scale back their investment or hiring. Moreover, if recent supply constraints and hiring difficulties turn out to be more persistent, they could hamper the recovery for longer. On the upside, however, households could spend the excess savings they have built up to a greater extent or at a faster pace than in our baseline scenario (as illustrated in the alternative scenarios in Box 1).
Inflation is expected to increase sharply in 2021 on the back of higher commodity prices, but should remain contained at around 1.2% in 2022 and 2023; however, the risks to inflation are on the upside
Inflation as measured by the Harmonised Index of Consumer Prices (HICP) has risen significantly in recent months, climbing from 0.8% in February 2021 to 1.6% in April 2021. This increase largely reflects an expected base effect related to the recovery in oil prices, which has even continued since our last forecast. In addition, food prices, and in particular those of fresh produce, have been more dynamic than expected, as a result of the frost episode that affected France and neighbouring countries.
HICP inflation excluding energy and food, although less dynamic than headline HICP inflation, also increased markedly, slightly beyond our expectations, due to an acceleration in services prices following their slowdown in 2020. Despite the supply difficulties encountered in some sectors, manufactured goods prices were sluggish, mainly due to the decline in prices for clothing and footwear and pharmaceuticals. More pronounced price increases were nevertheless recorded for some products (such as household appliances and furniture). These may reflect price pressure in freight transportation and for some inputs (notably metals, wood, and semiconductors), but they remain rather moderate and localised at this stage.
After 2021, and once the fading of the base effect caused by the shocks observed in 2020 has passed, headline HICP is expected to grow at a rate of around 1.2% in 2022 and 2023 (see Chart 7 below), which is still below the levels expected before the health crisis. This moderate pace is attributable to the fact that the unemployment rate is only expected to fall gradually, and to our technical assumption, based on futures prices, that oil prices will be sluggish. It also includes an effect of the rise in industrial input prices, which should, however, be temporary (see Box 2 below).

As regards the risks to inflation, the rise in the prices of commodities and certain industrial inputs has been taken into account in our baseline scenario, but considering, based on past experiences, that these pressures will be transitory. However, this input price increase, and supply and recruitment difficulties, could be more pronounced or more lasting. This constitutes an upward risk to inflation over a period of time that is difficult to estimate precisely, but its magnitude should be moderate given the limited weight of manufactured goods in headline HICP (see Box 2).
Box 2 : The sharp rise in industrial input prices is compatible with moderate headline inflation
Since the beginning of 2021, the prices of a large number of inputs in production process have risen sharply. In April 2021, the price of a barrel of Brent crude oil reached EUR 54, while in April 2020 it stood at EUR 21, its lowest level since 2001. Year-on-year, import prices for food commodities rose by 12.8%, and those of industrial products climbed by 41.5% (as a result, in particular, of a 54.6% surge in the price of mineral materials). In addition to these sharp increases in commodity prices, supply difficulties pushed up the price of sea freight and semiconductors. Against this backdrop, business survey indicators such as the Purchasing Managers’ Indices (PMI) for input prices (see chart) and finished goods price forecasts in the manufacturing sector, as well as producer prices in French industry, picked up significantly from their lows in 2020.
However, these price increases must be put into perspective. On the one hand, it is not unusual for transitory misalignments between supply and demand to generate upward pressure on prices during a recovery, and such year-on-year changes have been observed in the past. For example, the year-on-year price changes in food and industrial commodities, while high, remain below their 2011 peaks. On the other hand, for many indices, the annual changes observed in April 2021 partly reflect a base effect, following the sharp price decreases observed in 2020, and the levels reached have not exceeded the historical peaks. For instance, the price of a barrel of oil remains for the time being below its level, which itself did not constitute a peak, at end-2019 (EUR 59 in December 2019). As regards the PMI for input prices and finished goods price forecasts in the manufacturing sector, they are close to their early 2000s peak, but still well below their historical peak of 2011. Finally, while producer prices in French industry have risen sharply, this is mainly attributable to sectors that are heavily dependent on oil products.
The degree and speed of transmission of input price increases to consumer prices varies across sectors, depending on the share of commodities in their costs. At this stage, these increases are only partially reflected in the Harmonised Index of Consumer Prices (HICP). Admittedly, energy prices increased sharply at the beginning of the year, and were up by 8.6% year-on-year in April 2021. However, food prices have slowed markedly (rise of 0.4% year-on-year in April, after 2.2% in February), due in particular to the freezing of tobacco taxes since November 2020, and to a negative base effect following the historical increases observed during the first lockdown in spring 2020.
However, we expect a fairly rapid transmission of agricultural commodity price increases to agri-food products in 2021, leading to an upward revision of our inflation forecast for this part of the HICP basket compared to our March 2021 forecast.
The HICP for manufactured goods has remained moderately dynamic (year-on-year growth of 0.3% in April 2021), due to several factors. On the one hand, manufactured goods prices traditionally react more slowly to changes in commodity prices than food or energy prices. On the other, clothing and footwear prices have fallen sharply over the past year due to destocking effects linked to lockdowns, as have prices of pharmaceutical products.
The fall in prices for these goods offsets the rise in prices of “other manufactured goods” (+0.9% year-on-year, on account in particular of prices of electronic products and furniture) which, without reaching the historical levels of August 2001 (+1.3%) or May 2012 (+1.5%), remains significant.
In terms of forecasts, the input price increase is expected to continue to be passed on to manufactured goods inflation, which should reach a peak in the first half of 2022, similar to that reached in 2001 (1.1%). However, manufactured goods inflation should then gradually decline as the transitory misalignments between supply and demand linked to the recovery dissipate. There is nevertheless still considerable uncertainty surrounding this estimate, both in terms of the magnitude and the time lag of the transmission. However, given the small weight of this component in headline HICP (23%), price increases beyond our expectations should have a small impact on headline inflation. Thus, if manufactured goods inflation were to reach a peak similar to the historical peak in the second quarter of 2012 (1.6%), the risk to our inflation forecast would only be around +0.1 percentage point.
Despite the resilience of employment, the unemployment rate should rise temporarily in 2021 as the labour force returns to its pre-crisis trend, before falling back again to well below 9% by the end of the projection horizon
Since the start of the public health crisis, and unlike in the 2008-09 financial crisis, the labour market has mainly adjusted to the activity shock via working hours per capita and much less via job numbers, thanks to the short-time work scheme. The recovery phase should now see a reverse adjustment, with more limited growth in job numbers than in effective working time, and the latter returning gradually to pre-crisis levels. The detailed first quarter national accounts published by INSEE confirm that working hours have started to rise.
In addition, in our baseline scenario, the improvement in economic activity is seen encouraging some of those excluded from the labour market since March 2020 (discouraged workers, those on a training course or in a sector that has been shut down) to look for work again, leading the labour force to rise sharply as of mid-2021 and to return to its pre-crisis trend (see Table 2). The unemployment rate should thus peak at 9.3% at the start of 2022. It should then start to decline again, reaching 8.7% by the end of 2023.

This scenario assumes that the hiring difficulties encountered in certain sectors or for certain skills will continue to rise as recruitment picks up, but without preventing a rebound in total employment, as already observed in the pre-Covid period. The risk is that these difficulties could rise faster and further than we currently expect, which would then hamper the jobs recovery.
The maintenance of the emergency measures and roll-out of the recovery plan should continue to weigh on government finances in 2021, but the situation should improve in 2022 and 2023
Despite the economic recovery, the government budget balance is expected to remain firmly in negative territory in 2021, with the deficit-to-GDP ratio coming out close to the 9.2% recorded in 2020. The main reasons for this are the roll-out of the recovery plan, which provides for expenditure of nearly EUR 30 billion in 2021, and the extension of the principal emergency support measures, such as the solidarity fund and cancellation of social security contributions for the worst-affected sectors, the short-time work scheme and the additional spending on health. Added to this will be the amounts set out in the supplementary budget law for 2021, which was announced after these projections were finalised. The cuts of around EUR 10 billion to production taxes included in the recovery plan will also have a negative impact, as will the cuts to taxes and social security contributions that were voted into law before the crisis (especially the gradual abolition of the housing tax, and the lowering of the corporation tax rate). On the upside, the first payout from the European Recovery and Resilience Facility (RRF) should help to ease the deficit. The government debt-to-GDP ratio is expected to continue rising in 2021. However, government debt should increase by less than the amount of the deficit, thanks notably to the use of cash reserves built up by general government in 2020, which should lower the need for new borrowing in 2021, and again in 2022.
At constant legislation, and assuming the measures in the 2021 supplementary budget law are indeed temporary and only affect our 2021 forecasts, the government deficit could gradually narrow towards 4.5% of GDP by 2023, driven by the unwinding of the emergency measures, and the receipt of further European support funds to finance the recovery plan. At the end of the projection horizon, therefore, the deficit should still be considerably higher than in 2019, when it stood at 2.2% of GDP (excluding the double-counting of the CICE). The main explanation for this will be the ratio of government spending (excluding tax credits) to GDP, which is expected to remain close to 55% in 2023, compared with 53.8% in 2019, and the tax-to-GDP ratio, which will be slightly over 43.5% by the same horizon, compared with 44.7% in 2019 (excluding the double-counting of the CICE). The government debt-to-GDP ratio should decline temporarily in 2022 as GDP growth remains strong and the deficit starts to narrow. However, it should then rise again in 2023 to over 115% of GDP as the deficit remains above the level needed to stabilise this ratio.
Appendices
Read the appendices
Eurosystem technical assumptions
Detailed projection
Additional indicators
Download the PDF version of this document
Updated on the 25th of July 2024