In order to contribute to the national and European economic debate, the Banque de France periodically publishes macroeconomic forecasts for France, constructed as part of the Eurosystem projection exercise and covering the current and two forthcoming years. Some of the publications also include an in-depth analysis of the results, along with focus articles on topics of interest.
Introduction
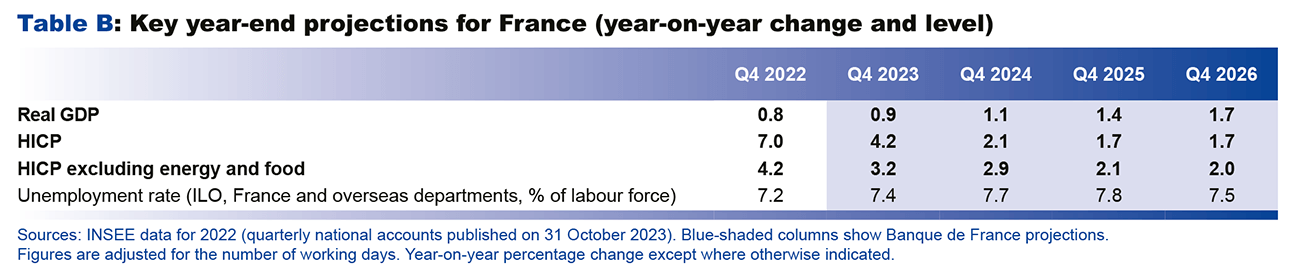
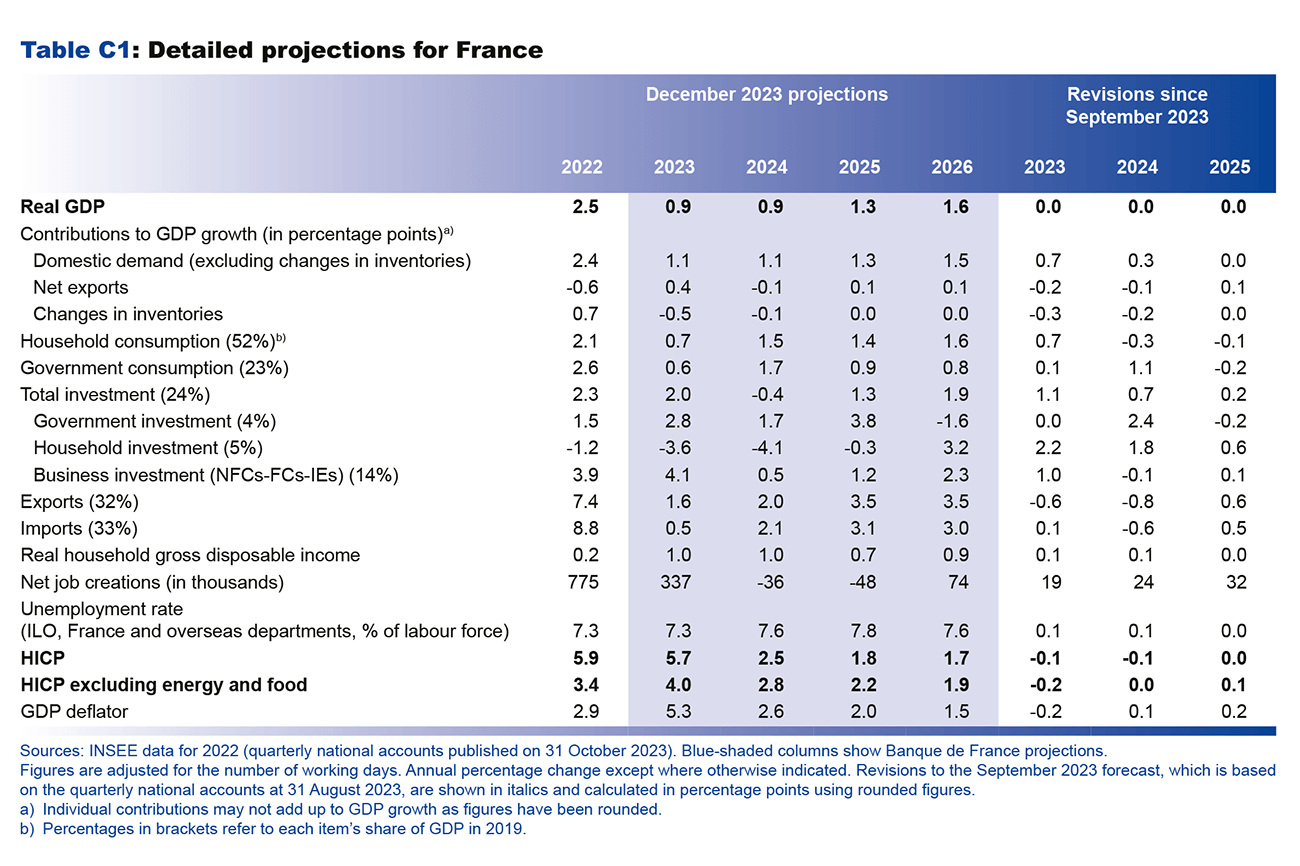
• These projections generally confirm our assessment that the French economy will gradually emerge from inflation without suffering a recession. In the short term, the latest information available suggests a slight downward revision of growth for 2023 to 0.8%. However, we are maintaining our growth projections for 2024 (0.9%) and 2025 (1.3%) unchanged, and we are expecting growth of 1.6% in 2026. This acceleration in 2026 assumes that the effects of recent shocks to the French economy (external tax shock, tightening of monetary and financial conditions) will have abated by that time.
• Economic activity is expected to remain sluggish in 2024 before strengthening subsequently. In 2024, growth should be driven to a greater extent by household consumption, due to the fall in inflation, which will benefit the purchasing power of wages, and to the lower saving ratio. In 2025, growth should also benefit from enhanced private investment as the impact of tighter monetary and financial conditions will be weaker. In 2026, these trends should strengthen to generate a strong recovery.
• Headline inflation (HICP), which peaked in early 2023, is expected to continue to subside: after averaging 5.7% in 2023, inflation should fall sharply, to 2.5% in 2024. This projection has been revised slightly downwards compared with the September forecast. Headline inflation should decline substantially over the forecast horizon, helped by falling energy prices; core inflation (i.e. HICP excluding energy and food) should also come down, albeit more slowly. Provided there are no new shocks to commodity import prices, headline inflation should gradually come back towards 2% by 2025 at the latest, and then remain at a slightly lower level.
• The turnaround that we forecast in the labour market now appears to be underway. Over the next few quarters, following a time lag, employment is expected to adjust to the economic slowdown observed since late 2022, with only a partial recovery of past productivity losses. Consequently, the rate of unemployment should continue to rise, although it should stay under 8% in 2025, before resuming a downward trajectory as economic activity recovers.
• On the whole, in an uncertain environment, the risks to our projections appear to be slightly negative for economic activity and balanced for inflation.

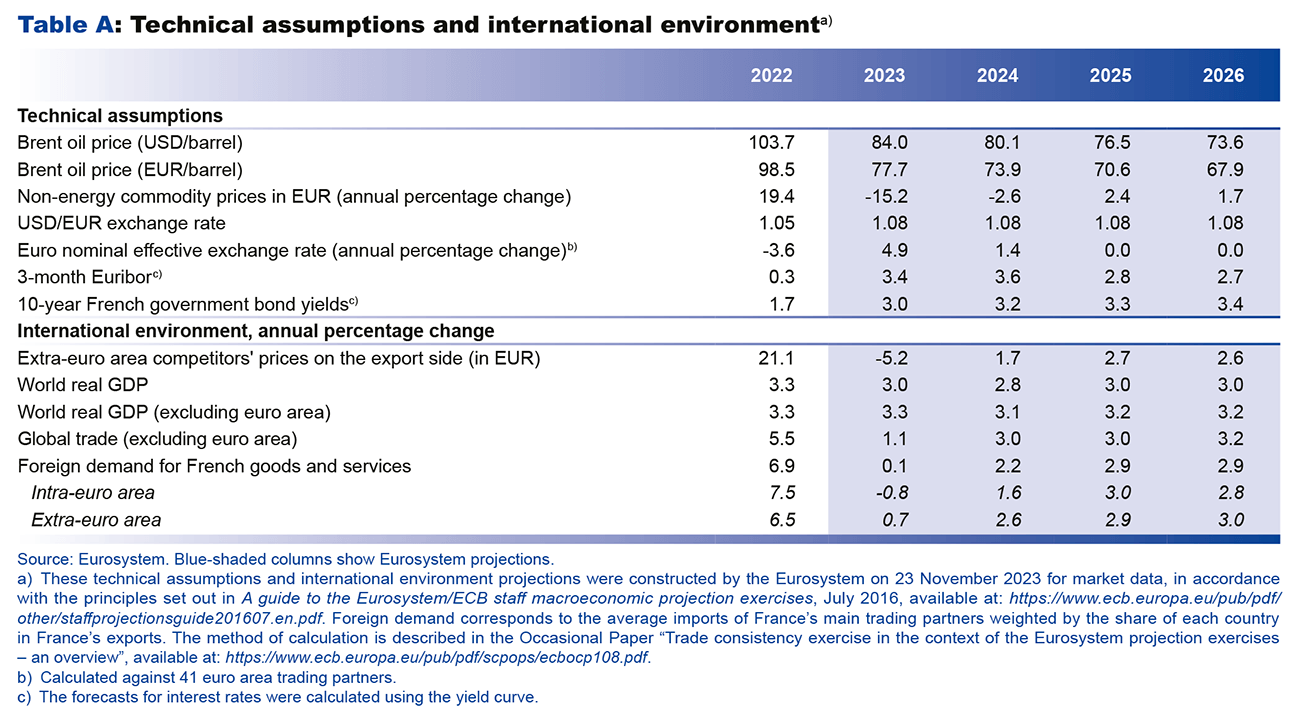
These projections are based on Eurosystem technical assumptions, for which the cut-off date is 23 November 2023. They also include the first estimate of HICP (Harmonised Index of Consumer Prices) inflation for November, published on 30 November 2023. Lastly, they incorporate the first estimate of the national accounts for the third quarter of 2023 published by INSEE on 31 October 2023, together with information contained in the 2024 budget law. However, they do not include the detailed results of the third quarter 2023 national accounts published on 30 November 2023 although these estimates do not call into question our medium-term analysis (see Box 1 below).
Economic activity is expected to remain sluggish in 2024, before strengthening in 2025 and 2026
After a strong first-half 2023, GDP fell slightly in the third quarter (-0.1%, revised downwards after an initial estimate of +0.1%). Based on the results of the Banque de France’s most recent Monthly Business Surveys, GDP is expected to grow at a rate of 0.1% in the fourth quarter, mainly thanks to market services. This latest economic data, which could not be included in the final projection, suggests GDP growth of 0.8% in 2023, compared with 0.9% in the projection finalised on 30 November. However, these figures do not call into question our medium-term GDP projections (see Box 1).


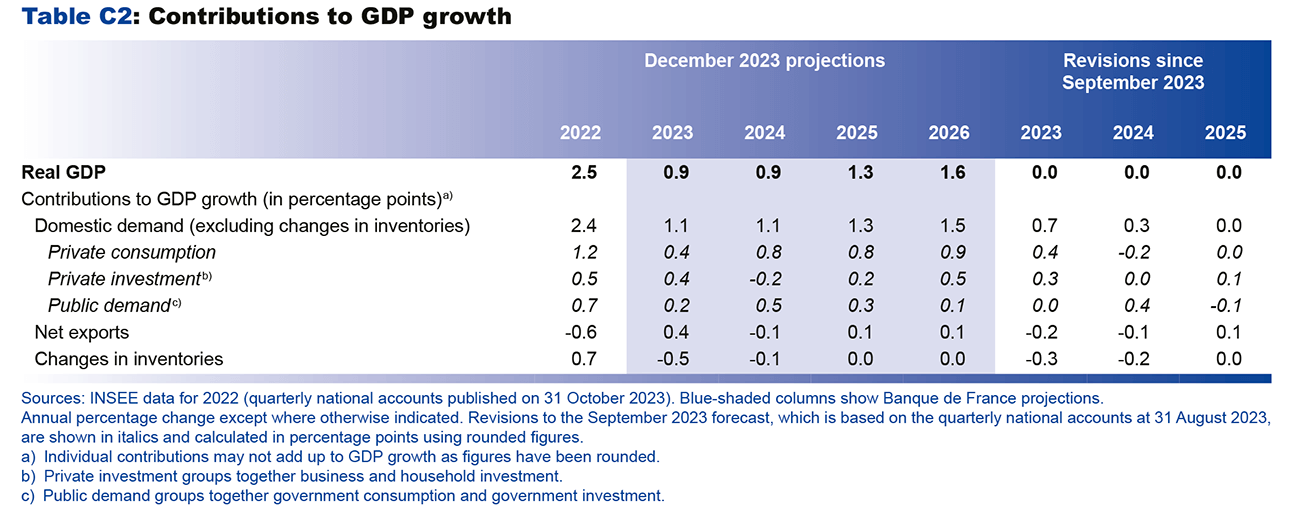
In 2024, GDP growth is expected to remain at 0.9% but to be driven to a greater extent by domestic demand than in 2023 (by 1.0 percentage point [pp], after 0.5 pp in 2023 – see Chart 2 and Table C2 in the Appendix), while the contribution from external trade is expected to turn slightly negative in 2024 (-0.1 pp, after 0.4 pp in 2023). Household consumption, whose contribution is expected to increase in 2024 (0.8 pp, after 0.4 pp in 2023), should benefit in particular from the higher purchasing power of wages attributable to the fall in inflation, partly offset by lower employment, a delayed consequence of the economic slowdown.
In 2025, GDP growth should rise to 1.3%, still buoyed by domestic growth drivers (mainly household consumption and business investment to a lesser extent). Consumption should continue to drive GDP growth (0.8 pp). Growth should also be buoyed by the positive contribution of enhanced private investment (0.2 pp, after 0.2 pp in 2024). The negative impact of interest rate hikes on private investment should begin to peter out in 2025, and private investment should accelerate thanks to enhanced demand.
In 2026, GDP should grow by an average of 1.6% for the year, i.e. at a higher rate than potential growth (a little over 1%). This would be attributable to several factors. Firstly, the shock to terms of trade (defined as the change in import expenditure net of export income since 2021 attributable to price changes, in GDP points) should continue to recede: from around 1.3% of GDP in 2022 compared with the reference year of 2021, the external tax shock to the French economy should fall to approximately 0.3% in 2023, before stabilising at around 0.1% at the end of the projection horizon. This would improve the situation of the different French economic agents: households in terms of purchasing power, businesses in terms of margins, and general government in terms of the government budget balance, although this is in a worse state now than before the Covid crisis. In addition, the impact of tighter monetary and financial conditions on private investment should continue to subside by 2026. Lastly, economic activity should be buoyed by the continued fall in the household saving ratio, although not to its pre-Covid level (see section on household income and consumption below).
Compared with our September projection, we expect very similar cumulative growth through 2025 (see Chart 1 above), underpinned by diverging offsetting factors. Certain factors should push GDP projections higher when compared with the previous projection. The negative inflationary pressure on household purchasing power and economic activity is expected to be slightly less severe (see section on inflation below), due in particular to slower growth in wholesale gas and electricity prices, reflecting expectations on futures markets. Public support for economic activity should be greater than we had anticipated in the September projection, especially in respect of public investment in 2024 and energy transition support measures such as MaPrimeRénov’. Conversely, other factors could have a bigger downward impact on economic activity than in the September projection, primarily the impact of tighter lending conditions for household and business investment. The international environment is also likely to weigh more heavily on growth, with foreign demand for French goods and services less buoyant than in our previous projection. However, this would be partially offset by a slightly weaker euro, which would help French exports to gain market share.
Box 1 : Latest economic data: slower growth in the short term but no change to our medium-term projections
According to the detailed quarterly national accounts published on 30 November, the change in third quarter 2023 GDP has been revised downwards by INSEE to -0.1%, compared with 0.1% in the first estimate. The carry-over effect for growth at the end of the third quarter has therefore been revised down to 0.8% for 2023 (instead of 0.9% based on the first estimate), and to 0.1% for 2024 (instead of 0.2%). This third quarter revision affects all the components of demand to varying degrees. Household investment has been revised sharply downwards, and is now expected to fall by 1.1% in the third quarter (compared with growth of 0.1% in the first estimate). Business investment has also been revised significantly downwards, from growth of 1.5% in the first estimate, down to 0.5%. Revisions are less significant for household consumption and exports. The one exception is public investment, which has been revised upwards and, along with public consumption, is helping to drive growth this quarter. Moreover, based on the results of the Banque de France Monthly Business Survey at the beginning of December, which were not available when these projections were being finalised (in late November), GDP is expected to grow by 0.1% in the fourth quarter of 2023, which would mean annual average growth of 0.8%. This estimate for 2023 is slightly lower than the projection of 0.9% finalised on 30 November.
However, these figures do not call into question our medium-term GDP projections due to the backlash that we had factored into the various components of investment. The slight increase of 0.1% in third quarter household investment, included in the first estimate of the national accounts, appeared unsustainable in view of the generally very poor economic indicators (housing starts and demand for housing). Similarly, business investment growth in the second and third quarters was well above its usual determinants (i.e. value added, cost of capital, investment in information and communication technologies, etc.), suggesting a subsequent downturn. For this reason, we have factored a backlash in these two components into subsequent quarters. Revisions to private investment in the national accounts for the third quarter therefore substantiate what we subsequently factored into the projection. Revisions to the other components (household consumption, imports) are of a lesser magnitude and should not alter our projections for forthcoming quarters.
Inflation continues to fall, with a gradual return towards 2% by 2025 at the latest
Inflation, as measured by the Harmonised Index of Consumer Prices (HICP), declined sharply during 2023, from 7.3% year-on-year in February, to 3.9% in November. This fall was attributable in particular to lower inflation in food and manufactured goods. Energy prices are also rising at a slower rate, although they are still experiencing some volatility due to the increase in regulated electricity prices in August 2023 and geopolitical tensions. Meanwhile, year-on-year services inflation has stayed at around 4.0% since February, reflecting in particular the gradual pass-through of the upward revision of the SMIC (minimum wage) and rises in industry-level negotiated wages, before a partly seasonal drop to 3.2% in November. For 2023 as a whole, headline inflation is expected to be 5.7% in annual average terms while inflation excluding energy and food should come in at 4.0%. The year-on-year change in the Harmonised Index of Consumer Prices (HICP) is expected to be 4.2% in fourth quarter 2023, and 3.2% for HICP inflation excluding energy and food (compared with 7.0% and 4.2% respectively a year earlier – see Chart 3 below).
In 2024, headline inflation should fall to 2.5%, while inflation excluding energy and food should decline more slowly to 2.8%. The slowdown in food price inflation is expected to continue (see Chart 4 below), in line with the sharp slowdown in agri-food producer prices witnessed over the last few months, provided that the price increases discussed during the upcoming trade negotiations to be completed in late January 2024 remain contained. As regards energy, despite geopolitical tensions in the Middle East, which have exacerbated the volatility of the price of oil, price expectations on international oil, gas and electricity futures markets imply that prices are set to fall. Inflation excluding energy and food should be driven mainly by services, reflecting the delayed impact of wage increases, while manufactured goods inflation should fall sharply in the wake of producer price inflation, which has been slowing since the start of the year.
Lastly, in 2025 and 2026, due to the combined impact of the continued normalisation of food and energy commodity prices and the delayed impact of past monetary policy tightening on inflation excluding energy and food, headline inflation should fall to 1.8% and 1.7%, respectively, and inflation excluding energy and food to 2.2% and 1.9%, without any pressure on the supply side at this stage of the economic cycle.


After falling in 2023, real wages are expected to rise significantly in 2024-26, at a rate close to that of labour productivity, which is itself accelerating
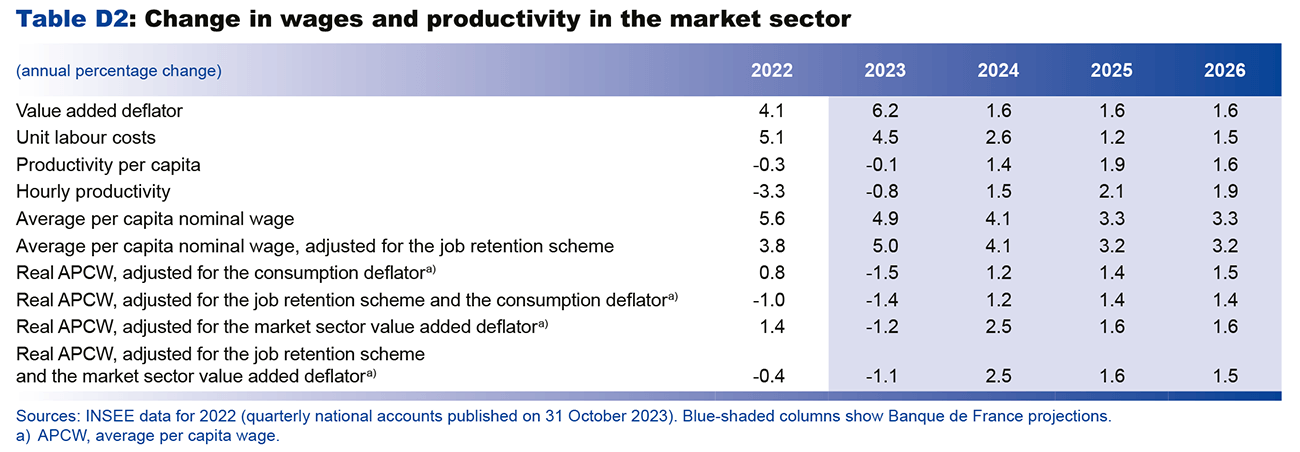
The year-on-year rate of increase in nominal wages is likely to have passed its peak in the first half of 2023 (see Chart 5 below). The high rate of increase in the first half of the year was driven by an additional significant upward revision of the SMIC (minimum wage), new increases in industry-specific wage floors and payment of the prime de partage de la valeur (PPV – value-sharing bonus). For 2023, the average per capita wage in the market sector should continue to grow at a rate that is unusually higher than the monthly base wage (which does not include the impacts of individual bonuses and overtime). However, real wages should fall in 2023, penalised by high average inflation during the current year (see Table D2 in the Appendix).
In 2024, average per capita wage growth will slow down in market sector industries, due to the expected decline in inflation and lower PPV payments, penalised by changes in taxation that will come into force on 1 January next year. For all employees, PPV payments will continue to be exempted from social security contributions but will no longer be exempted from income tax, the general social security contribution (CSG) or the contribution for the reimbursement of the social debt (CRDS). Overall, the average per capita wage is expected to grow by just over 4% and 3% in 2024 and 2025, respectively. In 2026, nominal wages should continue to grow at a fairly rapid rate, underpinned by the recovery in productivity gains and the resumption of the fall in the unemployment rate (see below).
As in the September projection, nominal wage growth is expected to slow by less than prices (see Chart 6 below), so real wages should start to grow again in 2024-26, returning to a rate of growth close to that of labour productivity, which is itself accelerating (see below). This mismatch between inflation and nominal wage growth is the result of generally annual wage negotiations as well as delayed indexation of the minimum wage.


After a cyclical turnaround in 2024-25 linked to the activity slowdown, employment should start to grow again in 2026
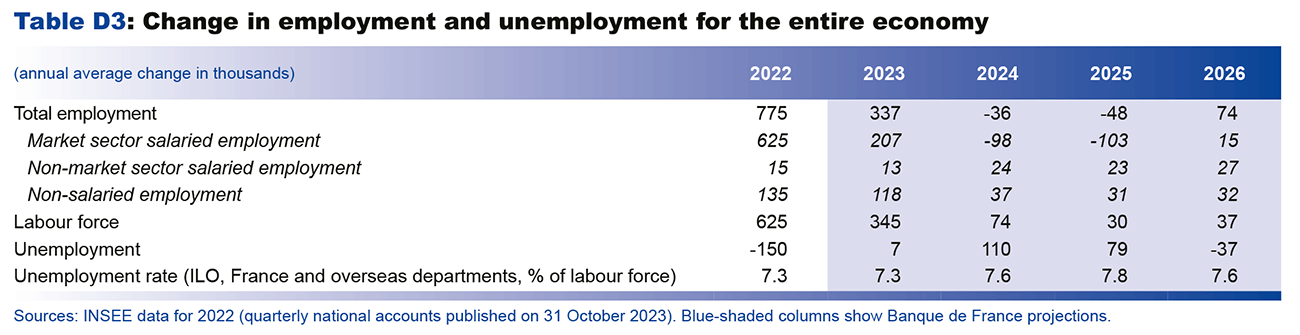
The latest available data confirm the labour market turnaround that we predicted in our previous projection exercises. The latest INSEE end-of-quarter figures on salaried employment, published on 29 November, show that market-sector net salaried job creations slowed significantly in the second and third quarters (16,000 and 21,000 net new jobs respectively, after 70,000 in the first quarter), and this was confirmed in the quarterly national accounts published on 30 November.
In light of the deterioration in available leading indicators (employment climate in business surveys,
pre-registrations of new employees), we expect salaried employment to fall as of the fourth quarter of 2023. The downward adjustment should then continue until 2025 (see Chart 7), reflecting both a delayed impact of the activity slowdown and a partial recovery in labour productivity, which has fallen markedly since 2019 (see Box 2 below). Productivity should be boosted by the gradual end of the labour hoarding observed in certain sectors, such as transport equipment. However, it is still being weighed down by other, more lasting factors (increase in apprenticeship contracts and reintegration of less qualified people) and should remain persistently below its pre-Covid trend.


Against this backdrop, the unemployment rate is projected to rise up to 2025, reaching 7.8% of the labour force (see Chart 8 above). It already started to move upwards in the third quarter of 2023 (7.4% after 7.2% in the second quarter). Although our short-term unemployment rate forecast is now slightly higher than in our September publication, our projection for 2025 remains unchanged. While our market sector salaried employment projection has only been revised slightly versus September, we now expect non-market sector salaried employment to be stronger, based on the information contained in the 2024 draft budget law. Moreover, assuming the trend in business creations does not come to a sudden halt, the slowdown in non-salaried employment should be slightly smaller than previously thought.
In 2026, French employment should start to rise again as GDP growth gathers pace. The unemployment rate should therefore start to pull back, declining to 7.5% in the fourth quarter of 2026.
Box 2 : What explains the loss of productivity since 2019 and what can we expect over the medium term?
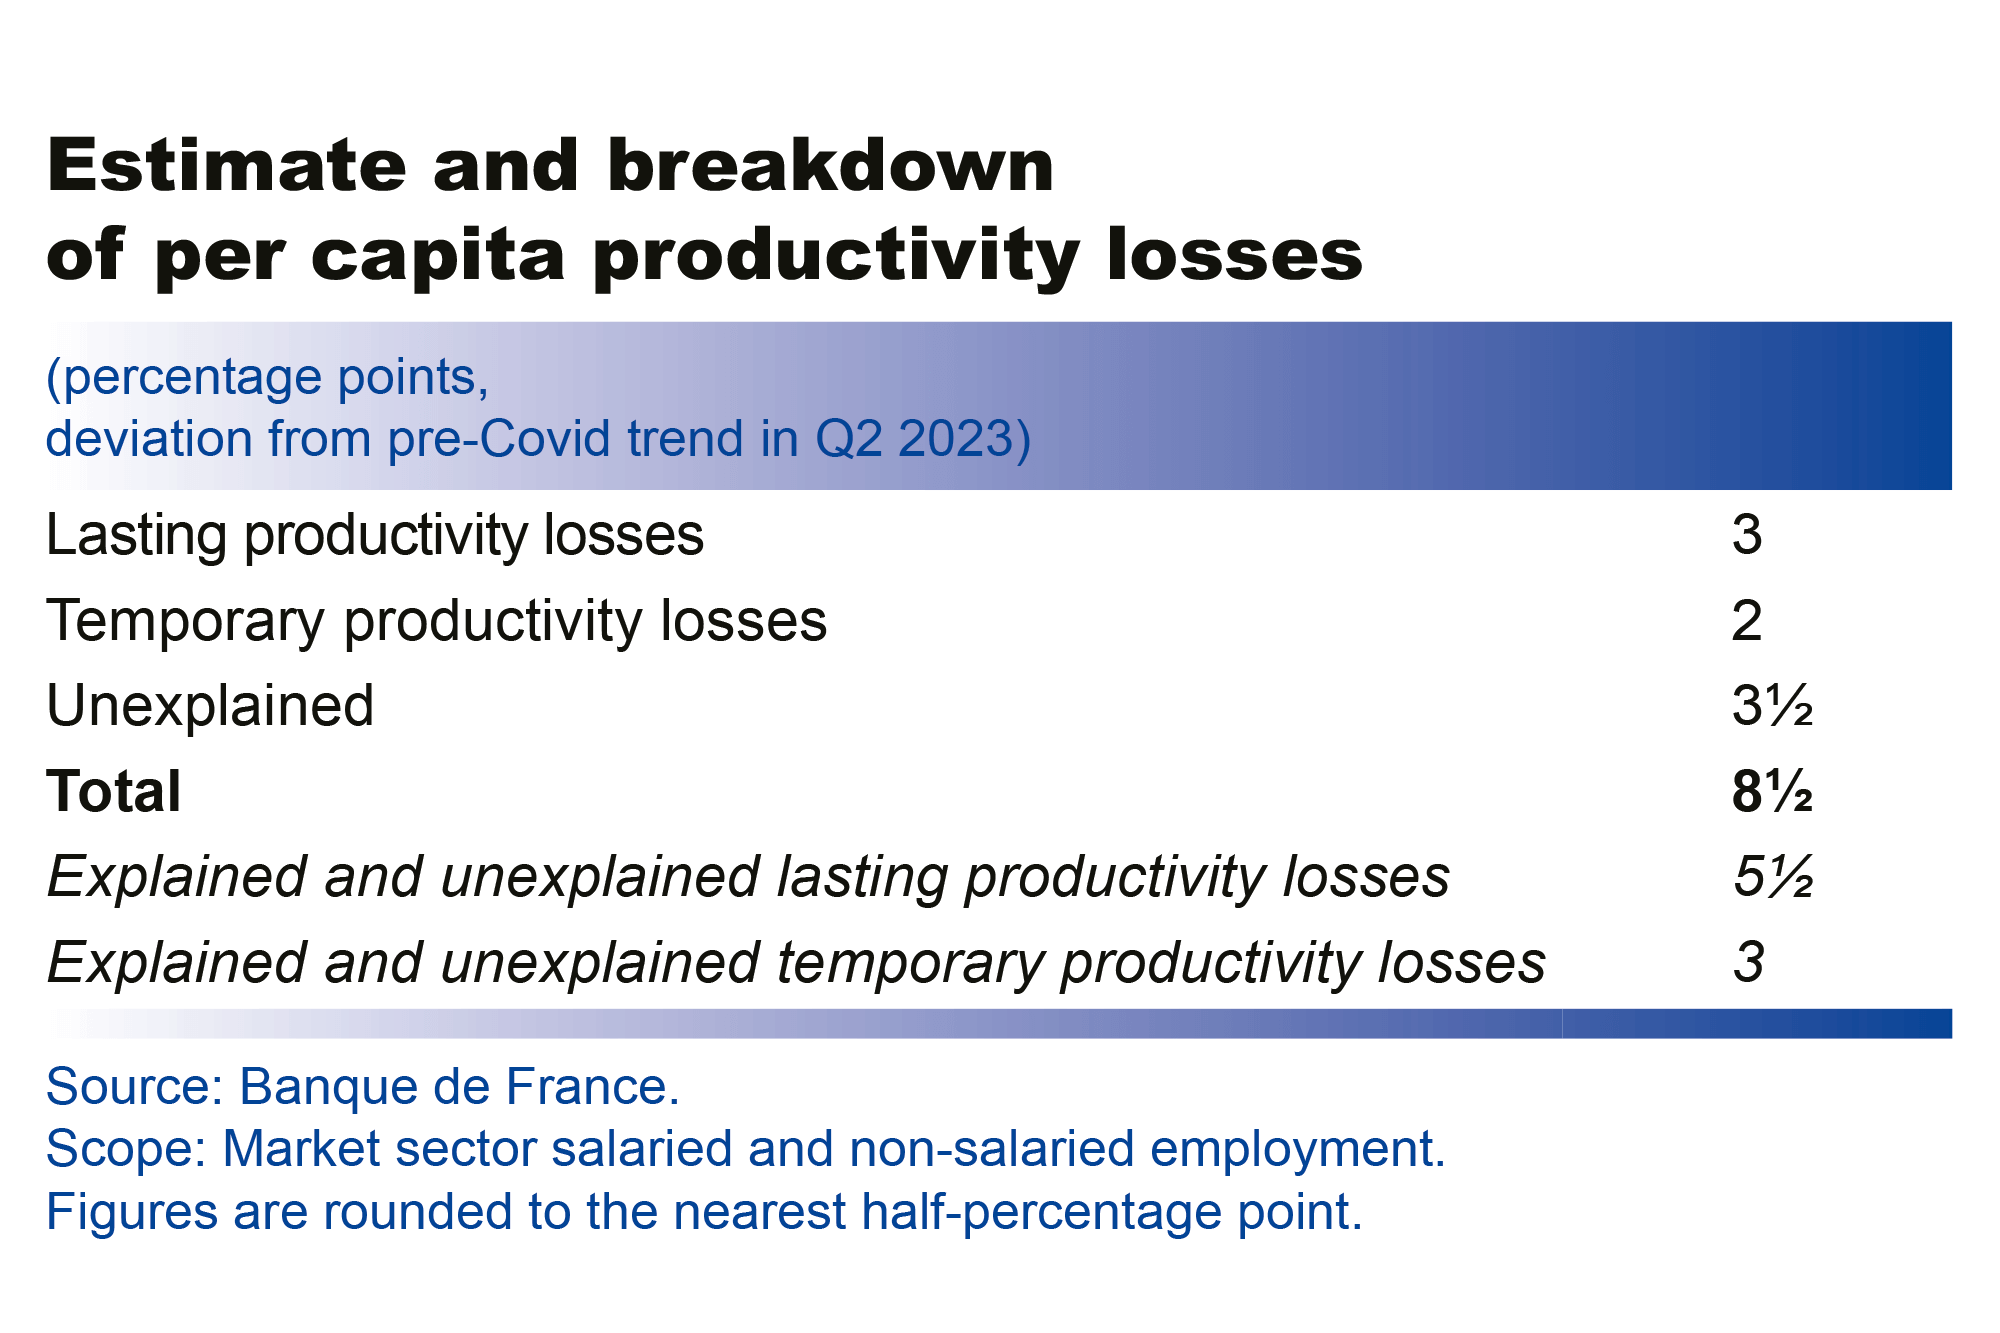
The following analysis was carried out using the national accounts published on 31 October 2023, which means that any revisions to GDP or employment in future quarterly account publications are liable to modify our assessment. There is therefore a degree of uncertainty surrounding the following estimates and we have rounded them off to the nearest half percentage point.
Since the end of 2019, employment has risen faster than value added in the market sector, resulting in a drop of around 6% in per capita productivity between the fourth quarter of 2019 and the second quarter of 2023. Relative to the pre-Covid upward trend (estimated between Q1 2010 and Q4 2019), the loss in per capita productivity stood at around 8½% in the second quarter of 2023 (according to the quarterly accounts published on 31 October 2023). Of this 8½%, 3 percentage points (pp) can be attributed to factors deemed to be lasting (impact of the structure of the labour force, increase in apprenticeships, effects of the Covid crisis, regularisation of undeclared employees, decline in postings of foreign workers), and about 2 pp to temporary factors (sectoral labour hoarding, residual use of job-retention schemes). The rest of the gap versus the pre-crisis productivity trend (about 3½ pp) remains unexplained. In the absence of detailed data on how much of this unexplained loss is attributable to lasting or temporary factors, we have assumed that the breakdown is similar to that for the explained loss. As a result, we estimate the lasting loss in productivity (explained and unexplained) at around 5½ pp (see table).
According to our estimates, the portion of this loss that can be explained breaks down as follows:
• The change in the structure of employee qualifications accounts for about 1½ pp (excluding the impact of apprenticeships).
The strong rise in the employment rate since 2019 has meant that individuals who are less qualified or who had dropped out of the workforce have been able to find work.
• The increase in apprenticeship contracts since the end of 2019, which should continue gradually up to 2026, has lowered productivity by around 1 pp. However, this rise in apprenticeships could have a positive impact on productivity over the longer term by improving the match between skills and jobs once these apprentices have fully joined the labour market.
• The direct impact of the Covid restrictions, which halted all productivity gains during the activity shutdowns (total and partial lockdowns), is estimated to account for around half a percentage point of the productivity loss.
• The regularisation of undeclared labour, estimated based on the medium-term impact on firms’ behaviour of the sanctions imposed by Urssaf, and the decline in postings of foreign workers, have not significantly lowered productivity.
The temporary and explained productivity losses are estimated at around 2 pp:
• Certain sectors, such as transport equipment, construction, accommodation and food services, and information and communication, appear to be overstaffed (after correcting for lasting effects and for temporary effects linked to job retention schemes), and at the same time have lower margin rates in 2023 than in 2018. The overstaffing can therefore be interpreted as labour hoarding in certain sectors due to the difficult recruitment environment, as the activity slowdown is considered temporary. This accounts for the majority of the explained loss in per capita productivity (around 2 pp).
• The residual use of job retention schemes in the first half of 2023, which should gradually come to an end over the medium term, has played a more marginal role and does not account for a significant portion of the productivity loss.
Looking forward, we assume that the sectoral labour hoarding will largely be reabsorbed by 2026 due to activity growth or job cuts. As a result, by the end of the projection horizon, per capita productivity should gradually come back to just below trend, corrected for the losses deemed to be lasting (see chart).
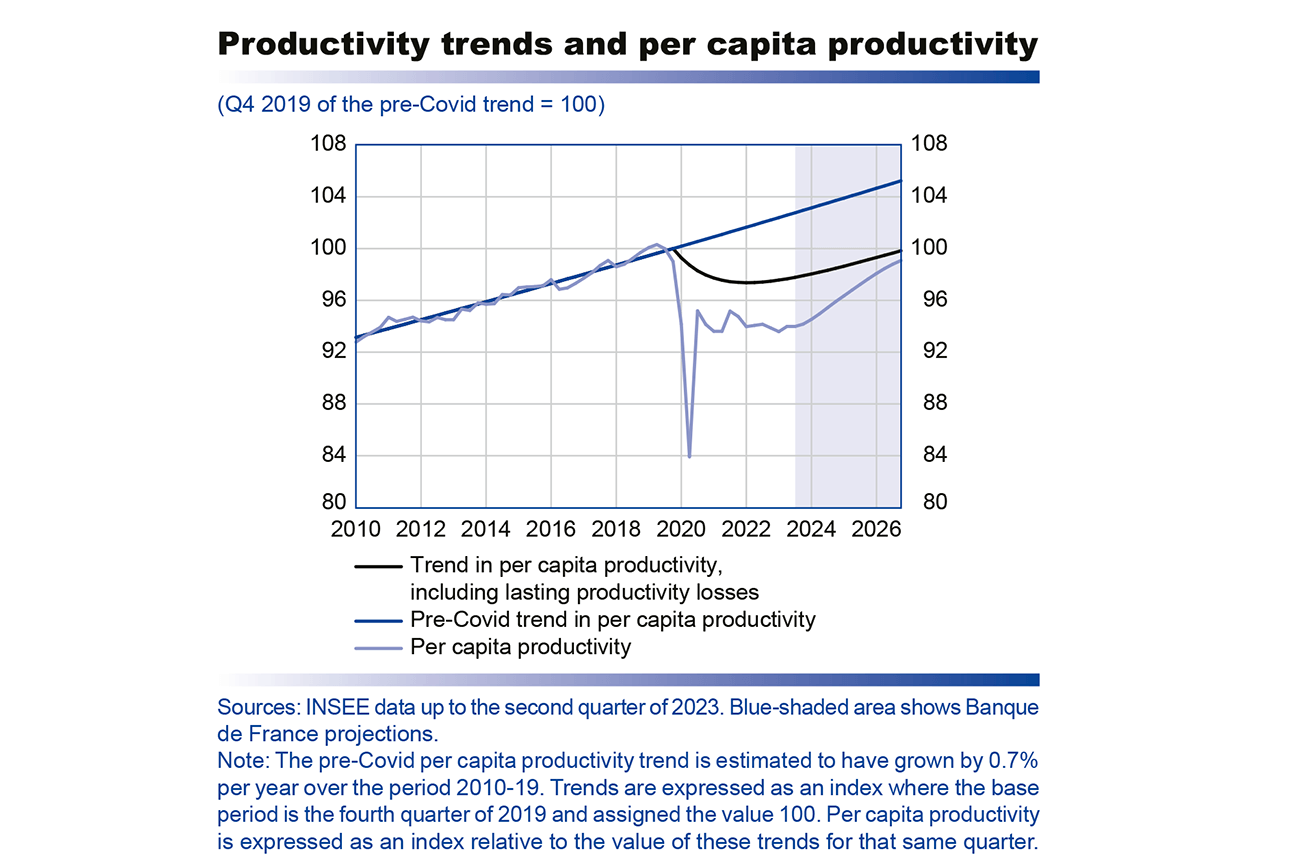
It is important to note that the lasting productivity losses stem largely from factors that have boosted the employment rate (including the rise in apprenticeships and re-entry into the jobs market of people who were previously economically inactive) and hence the level of activity. The majority of these losses are therefore attributable to the entry into the jobs market of a larger share of the working-age population, which is liable to increase potential GDP over the medium term.
Household consumption has been revised up for 2023 and should become the main driver of growth again
Household consumption has been revised up quite significantly over recent quarters, due notably to the use of new, more detailed cash register data in INSEE’s monthly estimates of food product consumption. The latter has still fallen to an unprecedented extent (drop of around 10% in volume terms between March 2021 and September 2023), but the revisions have reduced the decline by around a third.
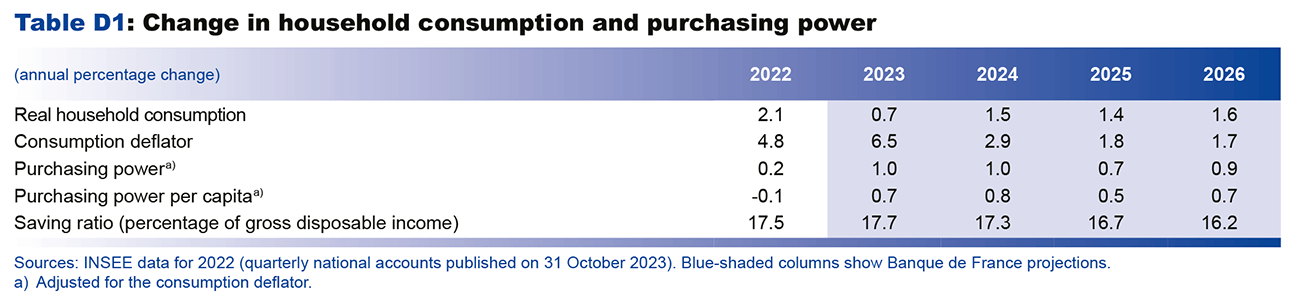
Over the projection horizon, household consumption should be buoyed by purchasing power, which rebounded in 2023 and should continue to rise (1.0% growth in 2023 and 2024, 0.7% in 2025 and 0.9% in 2026). These gains should stem primarily from above-inflation average per capita wage growth, which will replace the strong jobs growth seen in 2021 and 2022 as the main driver of purchasing power (see Chart 10 below).
The rise in purchasing power in 2023 may differ from households’ own perceptions of their finances. First, it is an average forecast, and individual situations may vary depending on income levels and geographical location. Second, purchasing power takes account of all income items (property income, and income stemming from job creations and social transfers) and not just wages. Households’ real wages declined in both 2022 and 2023, but should start to pick up again in 2024. Lastly, day-to-day perceptions of inflation take greater account of frequent purchases, such as petrol and food products, than of headline inflation as measured by INSEE.
The saving ratio stood at 17.4% in the third quarter of 2023, which is high when compared with its standard determinants and with its long-term average (14.7% between 2000 and 2019). It is currently being supported by short-term factors, which should dissipate going forward (uncertainties over the geopolitical context, inflation tax which is eroding households’ non-interest earning wealth). However, in the medium term, it could be supported by changes in the structure of household income. In particular, income growth in the recent past has largely been sustained by financial income and by cuts to taxes and social security contributions, which are less directly consumed than labour income and welfare benefits (see Ouvrard and Thubin, 2020, Banque de France Bulletin No. 227/9). In light of this, while the saving ratio is seen declining over our projection horizon, it should remain well above the pre-Covid average at close to 16% (see Chart 9 below).
After rising at a sluggish pace in 2023, supported by purchasing power gains and the fall in the saving ratio, household consumption is expected to recover between 2024 and 2026, expanding at an average rate of 1.5% per year.
Household investment is projected to contract by 3.6% in 2023 and by 4.1% in 2024. However, the forecast decline is now smaller than we anticipated in our September publication, due notably to the upward revision to household investment in the second quarter of 2023. Moreover, for 2024, the MaPrimeRénov’ scheme is expected to support household investment in the energy transition. Household investment is then seen stabilising over 2025, and rising again in 2026 as the impact of tighter financial conditions fades and household real estate purchasing power starts to improve.


After falling to a low in 2024 with the monetary and financial tightening, business investment should gather momentum as of 2025
The tightening of financial conditions (higher cost of financing and tightening of lending conditions) should continue to weigh on business investment, with the latter seen reaching a low in mid-2024, then picking up again in 2025-26 (see Chart 11 below). The impact of monetary policy on investment growth, via financing costs, should peak in 2024 and then dissipate over 2025 and beyond. The Bank Lending Survey still shows a clear tightening of lending conditions for firms, although with a slight easing in the third quarter of 2023 relative to the previous quarter. Conditions are expected to remain tight for a few more quarters and then to normalise again. Once these barriers have been lifted, investment should recover over 2025, supported by the acceleration in activity and resilient corporate margins.
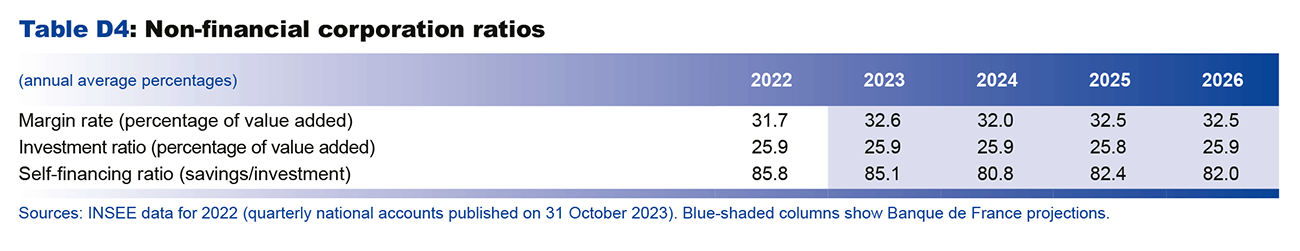
After rising to 31.7% in 2022, the non-financial corporation margin rate is expected to remain relatively stable over the projection horizon, coming out at 32.5% in 2026 (see Chart 12 below). The gains in per capita productivity should help to offset the robust real wage growth, whereas in previous years productivity losses were offset by falls in real wages. The extension of recent fiscal support measures (cuts to production taxes, investment subsidies, etc.) should also help to keep the margin rate high up to 2026 relative to its pre-Covid level of 31.5% in 2018 (2018 is used as the reference point for the pre-Covid period as 2019 was affected by the double-counting of the Tax Credit for Competitiveness and Employment or CICE). However, this impact should be mitigated to an extent by a partial transmission of the measures to wages and prices. The margin resilience also needs to be put into perspective as firms’ financial costs are set to rise as they renew their loans at higher interest rates.


In the absence of new measures, the reduction in the government deficit should be insufficient to lower the debt-to-GDP ratio by 2026
In 2023, the government deficit is projected to remain stable versus 2022, at around 4.8% of GDP. As a share of GDP, both government revenue and expenditure are expected to fall by close to 2 pp compared with 2022. On the revenue side, corporation tax receipts should gradually normalise after the high levels seen in 2022. Moreover, the latest available data suggest that VAT and real estate transfer tax receipts will be lower than previously expected. Other factors that should weigh on receipts include the abolition of around half of the cotisation sur la valeur ajoutée des entreprises (CVAE – corporate value added tax). The government expenditure-to-GDP ratio should decline as the public health crisis measures and recovery plan come to an end, although these have been partially replaced by new measures such as France 2030 and the green fund. The debt interest burden is projected to shrink slightly versus 2022 as a share of GDP, as the impact of higher interest rates this year should be offset by a fall in the inflation benchmarks to which France’s indexed debt is tied. It should nonetheless remain higher than in 2021 (1.7% of GDP in 2023 compared with 1.4% in 2021).
Beyond 2024, and barring any new measures on top of those already known when these projections were finalised, the government deficit is seen shrinking progressively, reaching 3.9% of GDP in 2026 – which is still higher than before the Covid crisis. The reduction should stem from a fall in the expenditure-to-GDP ratio combined with a stable revenue-to-GDP ratio. That said, the expenditure ratio (excluding tax credits) should still be much higher than in 2019, due notably to an increase in the debt interest burden and the continuation of certain discretionary measures (France 2030, environmental measures, etc.).

After falling slightly to 109.9% of GDP in 2023, the government debt ratio should stop declining and, barring any new measures, edge up to 111% by the end of the projection horizon, which is only slightly below its 2020 level. In comparison, the overall euro area ratio is predicted to fall by 9 pp between 2020 and 2026 (to 88% of GDP according to Eurosystem projections), wiping out almost all of the previous rise. As a result, France’s debt-to-GDP ratio is expected to be more than 20 pp higher than the euro area’s by the end of the projection horizon (see Chart 13).
The risks to our baseline projections for activity are slightly negative, while those to inflation are balanced
As in September, our projections are surrounded by significant geopolitical uncertainty, owing notably to the war in Ukraine, tensions between the United States and China, and now the situation in the Middle East. A worsening of these tensions could have consequences for oil and gas prices, global trade and uncertainty levels. This would pose an upside risk to inflation and downside risk to GDP growth.
In the specific case of France, there is still an upside risk to consumption, as the saving ratio could return more rapidly towards its pre-Covid level. Regarding inflation, talks between retailers and food producers could have a larger than anticipated downward impact on food prices. More generally, there is also a possibility that the fall in energy prices and effects of monetary policy could lead to a more rapid deceleration of overall consumer prices.
The trajectory of business investment is also subject to risks. On the one hand, firms’ debt interest payments are set to rise as they renew their existing loans at higher rates than previously. These higher financial costs could in turn weigh on recruitment and investment expenditure. On the other hand, business investment has often surprised on the upside in the past and could remain resilient over the coming quarters, buoyed by the need for investment in the digital and ecological transitions.
Appendices
Read the appendices
Eurosystem technical assumptions
Key year-end projections for France
Contributions to GDP growth
Additional indicators
Updated on the 25th of July 2024