Letter to the President of the Republic: How France and Europe will defeat inflation

Letter submitted to
the President of the French Republic,
the President of the Senate and
the President of the National Assembly by
François Villeroy de Galhau,
Governor of the Banque de France
This Letter is once again devoted to inflation, the prime concern of French citizens. This is our priority as a central bank, and we are firmly committed to defeating it within the next two years. But first we need to shed light on the causes and symptoms of what is an economic and social disease. The current inflation wave was initially imported, resulting in late 2021 (post‑Covid recovery) and early 2022 (Russian invasion of Ukraine), from external shocks on energy and agricultural products. Even today,these two items are legitimately the focus of attention of our fellow citizens, as they are seeing the sharpest rises, especially food prices. But they are neither the most significant – only 30% of our consumption – nor the most lasting: energy inflation has already slowed down, leading to a significant drop in headline inflation for the euro area, from 10.6% at the end of October to 6.9% today, and from 7.1% to 6.7% for France.
In the meantime, inflation has become more domestic, and has unfortunately spread to all goods and services : “underlying” inflation, excluding energy and food, has reached 4.6% in France, and may become more entrenched. This is precisely where monetary policy can and must act.
The disease of inflation would be even more serious if it were to become chronic: purchasing power would be significantly impacted, whereas it was ultimately preserved on average in 2022, and should continue to be so in 2023, even though this is obviously not the perception of our fellow citizens. The danger would be a runaway price‑wage spiral and a price‑margin spiral in certain sectors: but these two risks currently call for vigilance rather than a full‑scale alert. Lastly, the confidence of French citizens in their currency, the euro, remains historically high at 73%. These relatively favourable observations are a further reason to treat the disease at an early stage.
The fiscal treatment was the first to be implemented in France : the price shields put in place since 2021 were effective in temporarily damping the energy shock, but they cannot eliminate it. Once again, it is essential to move away from the “whatever it takes” approach, which was only justified for the exceptional Covid shock. While our government deficit will be this year one of the highest in Europe, these costly measures – around EUR 50 billion in 2022‑23 – must be brought towards zero, by taking advantage of the current slowdown in energy prices, and unfunded tax cuts must be stopped.
The most effective weapon against inflation is now monetary : without causing the feared recession, the Eurosystem has acted quickly and decisively over the past year to exit from the exceptionally accommodative financial conditions previously required by too low inflation. Today, credit is logically more expensive in Europe: however, it is in France that it remains the most favourable, and widely accessible to households and businesses. The soundness of the French banking system shields it from the specific problems experienced by certain US regional banks or by Credit Suisse. Given the one to two‑year lag in the transmission of the current monetary tightening, the central bank is committed to bringing inflation back towards 2% by end‑2024 to end‑2025. Household and business inflation expectations show a reasonable degree of confidence at this horizon, and should therefore contribute to a gradual decline in inflation from its current peak.
However, our country must also mobilise to contain inflation and increase our growth: to meet demand, we must produce more and do so more efficiently by beefing up our supply and innovation capacities. The disruptions in our environment thus call for a comprehensive, fair, and enduring economic transformation strategy, in four areas. The first two concern the whole of Europe: achieving both the energy and climate transformation and the digital transformation.
But two areas of supply capacity concern our country more specifically: in order to address the public services crisis, we need to achieve a public services transformation that improves the efficiency of current spending and makes spending for the future the priority; the Banque de France is a modest but real example.
And above all, in a re‑legitimised social dialogue, pursue the transformation of work that must, at the collective level, involve a greater number of people still and, at the individual level, must be more qualified and attractive; recruitment difficulties are still the main obstacle to production for 52% of French companies today.
Our work remains the key to our collective success, to our purchasing power and to full employment.
In the face of inflation and current uncertainties, the levers of our economic destiny are largely in our hands: beyond the pressure of urgency, this conviction should give us greater grounds for confidence.
1. Inflation: causes and symptoms of an economic and social disease
This Letter is, in the Republican tradition, the occasion to consider the main economic and monetary challenges
of our time. This year, it is once again1 focused on the fight against inflation, which remains the primary concern of French citizens and the Banque de France’s core mission. The image used in this 2023 Letter is primarily that of
an economic and social disease (1); it is contagious in its causes and potentially detrimental in its consequences: on
purchasing power, but even more so on social dialogue and on economic confidence.
However, current inflation is not doomed to become a chronic disease or inevitable: we know the remedies (2), which are now less fiscal than monetary. The central bank is therefore firmly committed to achieving this: we will defeat inflation,
bringing it down towards 2% by end-2024 to end-2025. But in the long term, in order to increase supply and to help
bring prices down, we must also strengthen our productive capacity.
1.1 Origins and spread of inflation
Since it reappeared in 2021, inflation has risen at a rate unseen since the 1980s. After its peak in October 2022 at 10.6%, as energy prices eased, inflation in the euro area has nevertheless begun to ebb to 6.9% in March, although significant differences were observed across countries (see Chart 1). In France, while support measures initially helped to keep inflation at a lower level than in most of our European neighbour countries, it still remains at a high level of 6.7% in March and is now mainly driven by food prices (see Chart 2).
From external inflation to domestic inflation,and more broad based...
This surge in inflation was triggered by a series of supply shocks. First, the Covid crisis caused major disruptions in global supply chains. It was almost immediately followed by the Russian war in Ukraine, which led to an unprecedented jump in energy and raw material prices (particularly agricultural commodities), of which France and Europe are net importers. While the energy shock and pressures on global supply chains are now beginning to subside, the resulting inflation has already changed in its nature. By spreading to the rest of the economy, these shocks have fuelled a more domestic inflation. The rise in companies’ production costs has led them to pass on this increase in their selling prices, particularly in the manufactured goods and food and agriculture sectors.


Domestic inflation is also being fuelled by the recovery in demand after the lifting of health restrictions and by “second round effects” linked to the gradual catching up of wages, driving up inflation in services. While the decrease in inflation in the euro area can now be attributed to the decline in energy and imported commodity prices, domestic inflation continues to rise in France and the euro area (see Chart 3).
Inflation is therefore not only higher but also more broad based, and has spread to all prices. Food prices rose by 15% in March and became the main driver of inflation, taking over from energy inflation (5.2%). These two components, the most keenly perceived by most of our citizens, account for about 30% of our average consumer basket and therefore of the price index. However, their rise should be temporary : energy prices have already started to slow down significantly, and food prices should start to decelerate in the second half of the year, in the wake of the turnaround in global agricultural prices. The other components excluding energy and food, which account for around the remaining 70% of inflation, are less spectacular but are likely to prove more persistent : manufactured goods prices have accelerated to 5.6% as have services prices, although they are rising more moderately (4%).

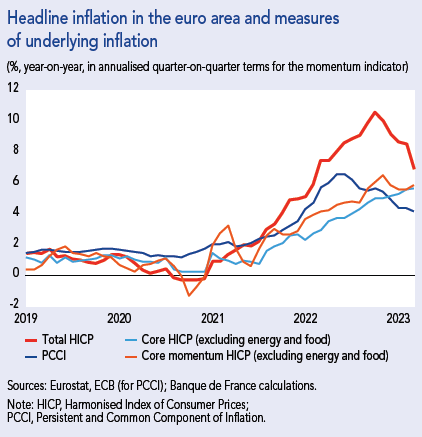
This change in the nature of inflation can be seen in the “underlying” inflation indicators, which give us more information about the medium-term outlook. They aim to remove temporary shocks from headline inflation in order to capture the underlying trend. The most common of these indicators is inflation excluding energy and food2 which therefore removes these consumption items whose prices are traditionally very volatile because they are dependent on international markets. Inflation excluding energy and food has increased significantly since 2021 (see Chart 4 below) and continues to stand at a level that is too high (4.6% in France and 5.7% in the euro area in March 2023).

therefore removes these consumption items whose prices are traditionally very volatile because they are dependent on international markets. Inflation excluding energy and food has increased significantly since 2021 (see Chart 4 below) and continues to stand at a level that is too high (4.6% in France and 5.7% in the euro area in March 2023).
At this stage, neither inflation excluding energy and food, nor a broader set of underlying inflation indicators monitored by the Eurosystem (see Box 1) are showing clear and converging signs of a trend reversal. This warrants us pursuing our monetary policy action (see 2.2)
According to our projections for France, headline inflation should peak in the first half of the year. At the end of the year, it is expected to recede to around 4%, with core inflation remaining high. In 2024, due to falling energy and food prices and the effects of monetary policy (see Part 2), headline inflation should decrease more sharply to around 2.5%, before gradually converging towards the 2% target by end-2024 to end-2025.
Box 1. Which Indicators to measure underlying inflation in the euro area ?
Measures of underlying inflation
Central banks monitor a range of complementary “underlying” inflation indicators1
- Like inflation excluding energy and food, other indices strip out volatile items, either permanently (fine core) or on a month-on-month basis (trimmed-means);
- Another “family” of indicators are model-based measures. The supercore index calculates inflation dynamics relative to the business cycle, while the Persistent and Common Component of Inflation (PCCI) indicator captures the common trend of about 100 sub-items of inflation for 12 countries in the euro area.
Base effect and “momentum” indicator
Inflation is usually measured on a year-on-year basis, comparing price levels today with those of a year earlier. This measure can be affected by “base effects”: if prices have risen sharply between February and March of the previous year, this can lead to a mechanical fall in year-on-year inflation in March of the current year, even though there is no fall in the monthly inflation rate. In addition to the various year-on-year measures, central banks therefore monitor price developments calculated over shorter time windows, for example three months.
This “momentum” indicator confirms that underlying inflation dynamics have not waned at this stage.
1 European Central Bank, “Inflation measurement and its assessment in the ECB’s monetary policy strategy review”, ECB’s Occasional Paper Series, No. 265, September 2021.


From actual to expected inflation
The spread of inflation entails an additional risk: too high inflation today could “contaminate” the future inflation expectations of economic agents (consumers, employees, business leaders, etc.), thus interfering with their consumption and production decisions, wage negotiations, investments and, more generally, the price-setting process. In this situation, inflation would become self-sustained with the risk of becoming entrenched. It is this scenario that we must absolutely avoid, and that is why it is crucial to anchor inflation expectations around our 2% target (see 2.2 below).
Expected rates in the financial markets (five-year forward) increased significantly above 3% in the spring of 2022, but have fallen since (see Chart 5a). They traditionally fluctuate in line with energy prices. Household and business leaders’ expectations are usually for their part more closely correlated with the actual level of inflation. According to the ECB’s Consumer Expectations Survey, household inflation expectations three years ahead in France rose in early 2022 to 3% (see Chart 5b) before stabilising, and appear to be showing signs of abating in the first quarter of 2023.
For its part, inflation expectations at the 3-5 year horizon of the 1,700 business leaders in France, surveyed each quarter by the Banque de France, increased in 2022 to 3% and have since stabilised at this level. Overall, there has not been a massive and greater “de-anchoring” of inflation expectations; but it is still important to bring them down towards 2%, in line with the central bank’s objective.
1.2 An economic and social disease that would be increasingly serious if it were to become persistent
The spread of inflation can lead to economic and social ills that rightly worry our fellow citizens, not least an erosion of their purchasing power. Like in 2022, over 60% of French people rank inflation and purchasing power as their main economic concerns in 2023.3
If inflation is too high, it can also trigger a runaway price-wage or even price-margin spiral. Finally, persistent inflation could lead to a high level of uncertainty that undermines confidence and affects our economic decision-making.
“Life is expensive”: a perceived loss of purchasing power, and inequalities in the face of inflation
“Life is expensive! We hear this complaint everywhere” wrote the economist Raphaël-Georges Lévy at the end of the First World War,4 before the expression resurfaced widely in the 1970s; today we are faced with similar concerns. Faced with inflation affecting everyday purchases, such as fuel or food whose prices have risen the most recently, the concerns of our fellow citizens are justified. Because of the frequency with which these products are purchased, perceived inflation now far exceeds actual inflation. For example, according to the European Commission, median inflation perceived by euro area households was 17% at the end of 2022, whereas actual inflation was close to 10%.
In practice, inflation affects the various categories of households to a greater or lesser extent, due to differences in the structure of their consumption5.
In France, households living in rural areas (see Chart 6a) and older households (see Chart 6b) were more affected by the rapid acceleration in energy prices in 2022.
Differences in inflation by household income are more limited, especially since the minimum wage and social benefits are indexed to consumer prices. However, this increase in the cost of living represents a larger share of their income for the least well-off households, while they have less financial leeway, and in particular few savings. Thus, European households with the lowest incomes perceive this inflation more keenly, at nearly 20%, compared to 14% for households with the highest incomes.6
This perception was accompanied in 2022 by a clear deterioration in the opinion of the least well-off households about their personal financial situation; according to INSEE,7 this opinion reached a historically low level in France in 2022 and has only improved slightly since then.


The Banque de France is more than ever mobilised to help people in difficult situations: the number of cases of overindebtedness in particular, while remaining significantly lower than in 2019 (the pre-Covid reference year), has risen in the first quarter of 2023 (up 6% compared to last year).
At the aggregate level, however, household purchasing power was preserved on average in 2022, with a decline limited to -0.1% in France, which followed a sharp rise of 2% in 2021.
This almost stable situation is obviously not perceived as such, but the lower inflation compared to our European neighbours, combined with a robust labour market (rise in the employment rate) and fiscal measures (price shields, revision of pensions and welfare benefits), have on average largely mitigated the decline in household disposable income. Average per capita purchasing power is expected to be almost stable again in 2023 (-0.1%), before picking up again in 2024 and 2025 on the back of an economic recovery (see Chart 7).

The risks of a runaway price-wage spiral
Given the magnitude of the inflation shock, it is normal for wages to undergo a catch-up process to prevent an excessive loss of purchasing power. But by increasing production costs, the rise in wages itself fuels the rise in prices : this phenomenon is known as the “price-wage feedback loop”.
This normal adjustment process must be set apart from a runaway spiral, which would push up inflation over the long run. This is the pattern that was observed in the 1970s, where households and companies
all suffered ultimately.
Unlike in the 1970s, wages other than the minimum wage are no longer indexed to inflation, but freely negotiated. As a result, wages have not adjusted uniformly to the inflationary shock. Workers on the lowest incomes have rightly been the most protected from inflation. The minimum wage was automatically raised five times between October 2021 and January 2023, representing a cumulative increase of almost 10%. These raises led a number of industries to increase their wage floors at the start of 2022, followed by a new round of wage negotiations during the year in several industries.8 This resulted in 2022 in higher growth in the base wages of blue-collar and white-collar workers (4.5%) than in those of managerial staff (3%).9 The growth of overall compensation has also been bolstered by the payment of bonuses, which make it possible to offset the loss of employees’ purchasing power on an ad hoc basis.10
Average per capita wages – which include notably these bonuses – grew less quickly than inflation in 2022 (see Chart 8), but are expected to rise by 6% in 2023, temporarily outpacing inflation at 5.4%, before returning to a more moderate rate as of 2024. The wage catch-up process should thus occur with a slight lag vis-à-vis inflation.

The sensitive matter of margins
As regards businesses, the rise in the input costs of theirproducts was on the whole at least partly passed on to their selling prices. At the aggregate level, the corporate margin rate thus fell less than expected, unlike what was observed in the 1970s: after reaching a peak of 34% in 2021, the margin rate stood at 32% in 2022, close to its pre-Covid level. In 2023 and 2024, corporate margins are expected to decline slightly and temporarily as a result of economic conditions, before starting to rise again in 2025. The margin rate would then be close to its 2018 level.11
Therefore, these developments in France do not overall appear to corroborate the assumption of a “price-profit spiral”, which is currently part of the public debate due to the margin behaviour of some companies, notably the largest ones. Indeed, these developments differ greatly across sectors (see Chart 9), and require a case-by-case analysis. Particular attention should be paid to developments in the energy sector and transport services (especially in the maritime freight sector). In the agri-food industry, after declines in 2020 and 2021, the margin rate has risen sharply in 2022 to a level close to that of 2018. In all events, it is hoped that competition and a degree of vigilance will lead firms to moderate their prices for the benefit of consumers. In the other sectors, however, the margin rate declined between 2018 and 2022, due in particular to the drop in productivity observed since 2019.

The situation in France thus differs from that of the euro area,12 especially in Germany and Spain, where margins have contributed significantly to the rise in inflation in 2022.
Uncertainty and loss of confidence
If the illness of inflation were to become chronic, it would ultimately become the main enemy of confidence, and therefore of growth. High inflation is often more volatile and harder to predict. Faced with this uncertainty, households and businesses may adopt a wait-and-see attitude and choose to postpone their consumption or investment decisions. Moreover, contrary to popular belief, inflation sustainably raises the cost of borrowing on the financial markets, both in nominal and real terms. Uncertainty about future inflation dynamics leads to an increase in the “term premium”, which is a key component of actual interest rates and directly linked to inflationary risk. If there were doubts about the ability to return towards 2% inflation in the medium term, or even worse, if – according to an idea sometimes put forward – central banks increased their inflation target, this “term premium” would structurally increase.
If the loss of confidence is too great, citizens may no longer accept their currency. In 2022, extreme inflation rates (above 70%) in Turkey and Argentina severely eroded the real value of their currencies. Citizens then shunned their national currency in favour of other stronger and more stable currencies: the Argentine peso and the Turkish lira lost almost three-quarters of their value against the dollar in 2022.
To a lesser extent, within the European Union but outside the euro area, Hungary experienced an inflation rate of 25.8% in February 2023. Of course, inflation rates in the euro area have never reached these extremes and Europeans’ confidence in the euro remains very high, with 73% and 79% respectively of favourable opinions in France and the euro area at the beginning of 2023;13 but these counter-examples show the key value of confidence in the currency.
A sharp drop in purchasing power, a price-wage or pricemargin spiral, a loss of economic confidence: thanks to the actions already taken, the French economy fortunately does not show any signs of these symptoms of persistent inflation. This is all the more reason to treat the disease in order to prevent it from becoming chronic.
2. Adopting the right treatments to deal with the disease
The disease of inflation is by no means a foregone conclusion: it is up to us to apply the right treatment. The fiscal treatment can only provide temporary relief. It is the combination of monetary measures and transformation actions, playing a role in moderating demand and increasing supply respectively, which can ensure recovery from this disease.
2.1 The temporary role of fiscal policy
In 2022, the sharp rise in energy prices resulted in significant additional costs for the French economy. Government support measures, most notably the price shields for electricity and gas, have almost entirely protected households and largely protected businesses. The net fiscal cost of these measures to offset this rise is expected close to EUR 50 billion for the 2022-23 period. One player, the state, has agreed to cover over half of the external levy, thus giving other economic agents more time to adjust to higher prices. This led to a reduction in actual inflation in 2022 of around 2.3 percentage points for headline inflation, and to a mitigation of second round effects in the medium term.
However, fiscal measures to compensate for inflation can only work for a limited period of time. The state can mitigate the energy shock, but not make it disappear; a new “whatever it takes” is not justified, and would even be counter-productive both for the climate transition (by sending the wrong price signals to economic players about energy) and for the purpose of keeping inflation under control (by supporting demand).
Yet, in 2022, more than 80% of support measures in France were not targeted, and benefited all consumers or companies equally. With the sharp decline in energy prices since the end of 2022, fiscal support must, by being perhaps much more targeted initially at those who need it most, be rapidly phased out within two years.
Otherwise, fiscal support measures may even exacerbate inflationary pressures in the medium term, which would require a stronger monetary policy response.14
Furthermore, the significant cost of measures to offset inflation has contributed to keeping public debt and the budget deficit in 2022 at much higher levels than expected before the energy crisis. Already high in 2019, public debt had risen sharply (and rightly so) to absorb the impact of the Covid crisis. However, we cannot leave our children a public debt whose share of GDP, 112%, has almost doubled in less than a generation (it was only 60% in 2002), and which is increasingly out of line with the euro area average, with a gap of over 20 percentage points of GDP in 2022. Yet, assuming that fiscal policy remains unchanged, this debt will continue to grow; in order to stabilise it over the next few years, real spending growth must be limited to a maximum of 0.5% per year (see Chart 10). Future fiscal policy should therefore consist in reducing public debt by stabilising taxation – we can no longer afford unfunded tax cuts, and a shifting tax environment is a French flaw –, and by directing spending towards future generations (see 2.3).

2.2 Monetary policy action
The commitment of our Governing Council is to bring inflation down towards 2% in the medium term, by end-2024 to end-2025.
To this end, following four successive rate hikes in the second half of 2022, last December our key rate
had already reached the “neutral rate” zone estimated at around 2%; we had thus completed the first phase, that of monetary normalisation (see Chart 11). Then in 2023 we started the second phase towards monetary stabilisation.
In March, our key rate therefore reached 3%. We announced that we would henceforth shift to navigation “by instruments”, based on three cockpit dials: the outlook for headline inflation, underlying inflation, and the strength of our monetary policy transmission. We remain more pragmatic and guided by the data than ever before, and will then be willing to stay at the “terminal rate” for as long as necessary. The 2022 sprint to raise rates has thus become a long-distance race, and the length will now be more important than the level. In addition, the Eurosystem has started to reduce the size of its balance sheet, by not reinvesting all of the principal payments from maturing securities (i.e. a reduction of EUR 15 billion per month from March to June 2023; the subsequent pace will be determined in due time according to data), and through a reduction of the amount of long-term refinancing outstanding (TLTRO; voluntary repayments by banks of EUR 850 billion already).
However, monetary policy – often seen as being technically complex – raises at least three questions that need to be explained here: through which channels does it act? Does it have collateral effects on access to credit and the soundness of banks? How quickly is it effective?

Monetary policy transmission channels
The “traditional transmission channel”, via monetary aggregates, has become less relevant. This channel was predicated on the idea that strong money growth would fuel inflation. But this relationship between money growth and inflation varies over time and is neither causal nor automatic.
Since the start of the asset purchase programmes in 2014, monetary growth has been contained, as the liquidity provided by the ECB was partly redeposited by the banks. During the Covid crisis, nevertheless, the exceptional fiscal and monetary support measures temporarily led to a surge in corporate and household loans and deposits. But since then, the growth of monetary aggregates in the euro area has fallen steadily to 2.9% in February 2023.15
A simplistic view of the “monetarist” approach could therefore today, paradoxically, turn out to reassuring, but artificially so. Moreover, this diminishing importance of monetary aggregates rules out the role of past accommodative monetary policies in current inflation, as is sometimes argued. There have been numerous supply shocks (see 1.1), but no serious economic explanation attributes current inflation to excess liquidity. Indeed, monetary policy nowadays acts on inflation mainly through two channels :
• The expectations channel, which has become much more important
Whether inflation expectations are those of financial markets to determine the level of interest rates, or of other economic agents (firms and households) to guide their decisions on future prices and wages, they play a key role in the transmission of monetary policy (see 1.1). By enabling the different economic players to coordinate their decisions based on a common and credible inflation target (2% in the medium term) central banks contribute directly to ensuring price stability.
• The financial conditions and demand channel
Monetary policy acts directly on financial conditions and thereby indirectly controls demand in line with the economy’s supply capacity, at a time when this capacity has been reduced by external shocks. Let us dispel a misconception at this point: unless there is another major external shock, the reduction in inflation achieved by the Eurosystem will not lead to a recession, given the resilience of activity and employment. The objective today is to prevent demand from re-accelerating faster than supply during the expected recovery in 2024-25. To achieve this, financing conditions obviously cannot remain the same today as they were when there was a demand shortfall, as in the past decade when inflation was too low. Technically, we are talking about “monetary tightening” or “restrictive” financing conditions, since we are above neutral rates after the normalisation conducted in 2022, but what does this mean in reality?

Through monetary tightening, the Eurosystem is primarily seeking to achieve an increase in real interest rates at different maturities. These real interest rates, which correspond to nominal interest rates minus inflation expectations, reflect the true financing conditions of economic agents; they stem from monetary policy decisions, but also from the inflation expectations channel. The current rise in nominal interest rates, combined with inflation expectations better anchored at their target level of 2%, has led real interest rates in the economy to rise substantially and, in line with our objectives, to move back into positive territory, which had not happened for over ten years (see Chart 12).
Central banks also look at credit aggregates, which are much more meaningful than monetary aggregates. The credit channel is especially important in the euro area since, unlike in the United States, most of the economy (households and firms) is financed here through bank credit.
The impact on access to credit and the soundness of banks
Although volumes have slowed, growth in outstanding loans in France remains significant (up 6.9% year-on-year for loans to businesses and 5.1% in housing loans to individuals in February – see Chart 13) For these two loan categories, credit in France remains less expensive and is growing faster than the European average (see Chart 14). This slowdown in credit supply is justified after the sharp net rise in private debt ratios in recent years; so is the increase in interest rates, provided that it remains gradual and orderly.


Overall, access to credit is more costly than during the years of ultra-accommodative monetary policy, but credit remains widely accessible. For example, in the fourth quarter of 2022, 90% of VSEs, 96% of SMEs and 98% of ISEs that applied for an investment loan were granted it.16 This was made possible thanks to the soundness of French banks, whose solvency ratios are close to historical highs, having more than doubled their capital since 2008.
At the end of 2022, common equity tier one (CET1) solvency ratio of the six main French banking groups reached 14.9%, i.e. about five percentage points above the minimum capital requirements.
The recent banking crises, specific to US regional banks and Credit Suisse, highlight in contrast the strengths of European banks : they are strictly supervised in the framework of the Banking Union; and due to the application of Basel III to all banks in Europe, they are also subject to stringent liquidity rules. In the United States, to date only 13 banks are regulated in this way, following the authorities’ decision in 2019 to exempt the vast majority.
Consequently, French and European banks are well equipped to adapt to the monetary tightening, even if it results in a slight reduction in available liquidity – and the Eurosystem has the necessary instruments to ensure their liquidity if necessary. In general, French and European banks benefit from rising interest rates thanks to their diversified model, their broad deposit base and their large loan portfolio. They clearly do not
suffer from the weaknesses of some US regional banks such as Silicon Valley Bank in the face of rising interest rates.
As regards Credit Suisse, for years it had suffered from two well-known failings: an unprofitable business model and excessive risk-taking. These issues had started to be addressed, but all too slowly, and the wave of mistrust in March forced an accelerated takeover by UBS.
The lag in the effectiveness of monetary policy
Monetary policy is always and universally effective in controlling inflation, as long as it is no longer solely driven by an imported supply shock (see 1.1). We have started to see its efficacy in recent months in the United States and Canada where goods prices and wages have begun to slow down. In Canada in particular, rate hikes began in March 2022. Inflation peaked in June 2022 at 8.1% before gradually falling to 5.2% in February 2023. Inflation excluding energy and food, which stood at 4.8% in the same month, seems to have started to decline. As these favourable developments are broadly in line with its forecasts, the Bank of Canada has decided to keep its rates unchanged since the beginning of this year.
At the same time, the lags in the transmission of monetary policy mean that the full impact on inflation of the rate hikes already underway will only be seen in several quarters.
These lags are traditionally assessed at between one and two years. While some research suggests that they may have shortened in recent years, particularly in the United States,17 these lags must in all cases be better monitored in relation to the economic and financial factors specific to each currency area. At any rate, the differed effect of our past interest rate hikes will be greater than that of our future decisions.
2.3 Four transformations to beef up our economy, towards better controlled inflation and higher growth
For the past three years, economic policies have been dominated by emergencies and crisis management. But alongside the monetary action and going forward, structural transformations of our economy are needed to strengthen our productive capacity and increase supply.18 They will enable us to better control inflation, by reducing our vulnerability to external shocks, and to increase our long-term potential growth. Two of these transformations – energy and climate, and digital19 – are common to Europe as a whole; two are more specific to our country: the transformation of work, and that of public services.
The energy and climate transformation, and the digital transformation (Europe)
Since 2022, it has become urgent to reduce our dependence on Russian oil and gas: this imperative of strategic autonomy, combined with the threat of global warming, means that we must reduce our consumption of fossil fuels. We must succeed in achieving even more radical energy and climate transformations.
Europe has made strong commitments in this area, with a goal of carbon neutrality by 2050 which will require additional investments of around EUR 500 billion per year until that date,20 or in France around EUR 70 billion (2.5% of GDP) in 2030.21 These investments can only be partially financed by the public sector; in order to reach this overall target, we need to mobilise our vast pool of European savings,22 which means that we need to move forward
quickly and concretely with a Green Capital Markets Union.23 The longer we put off taking action, the greater the cost of this transition and the resulting inflation (see Box 2 below).
European savings resources should also be mobilised to close the technological innovation gap with the United States and now even with China.24 This phenomenon seems to have amplified over the past fifteen years, particularly in the area of information and communication technologies.
This trend can be attributed as much to the low level of investment in research and development (R&D)25 as to the lack of available private funding – more European venture capital is needed.26 Both in France and more generally in Europe, digital technologies have been slow to spread, delaying the productivity gains they could bring.
Box 2. The impact of transition policies on inflation
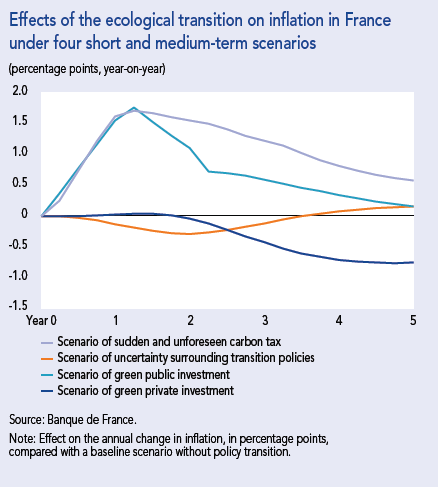
Transition policies could have effects on inflation through higher energy or industrial input prices, irrespective of whether they are generated by carbon price increases, regulations or pressures on the crucial minerals required for renewable energy.
The transition process could also affect inflation due to lags in the adjustment of relative prices of energy-intensive goods, or economic disruptions related to restructuring and adapting the productive apparatus.
All in all, the magnitude and duration of the effects of the transition to carbon neutrality on inflation will depend on the transition strategy chosen. Several possible scenarios in the short to medium term could result in moderately higher inflation, while other factors could have a dampening effect on inflation. More generally, the earlier and more gradually the transition is implemented, the lower the costs in terms of inflation.
Reference: Dees (S.), Gaye (A. de), Thubin (C.) and Wegner (O.) (2023), “The transition to carbon neutrality : effects on price stability”, Banque de France Bulletin, No. 245/3, March-April.
The transformation of work
For our country in particular, the supply of work is probably the most important transformation in order to increase production capacity and consequently the supply of goods and services, and thereby keep inflation under control.
To give just one illustration, recruitment difficulties are currently affecting the activity of more than half (52%) of French companies.27
In this area, our country has fallen behind on two counts, and firstly a quantitative lag. Despite significant progress and resilience to external shocks (more than one million jobs have been created since the end of 2019), access to the labour market is still lagging behind our European partners. This is particularly true for young and elderly people, who should not remain the “left-behind” in the French labour market (see chart 15 below).
For the youth, the spectacular development of apprenticeships (we are now close to one million apprentices compared to less than 500,000 at the end of 2019) is a French success story, which is hoped will keep growing.
By enabling many young people to rapidly develop their skills, they can be integrated lastingly and more quickly into the labour market. As regards the older workers, past reforms of our pension system have indeed helped them to gradually improve their access to employment over the past few years.
After the difficult current reform, we need to carefully rethink their place, and stop burdening unemployment insurance with the social cost of their dismissals and early termination of contracts.28
Our quantitative lag is partially due to a qualitative lag. The deterioration in the command of basic skills, in particular scientific skills, but also socio-behavioural skills, is confirmed and now concerns all pupils.29
In this context, strengthening initial training – in both general and vocational education – should be an overarching priority. It must be accompanied by a better targeting of available vocational training and a more efficient personal training account. These greater opportunities for training should pave the way to meet high qualitative aspirations. Beyond collective enrichment through work, we must find a way to enrich work itself.
The welcomed adoption of teleworking, which could eventually lead to productivity gains,30 a strong demand for autonomy and professional mobility and a real urge for a sense of purpose in work are all positive signs.31
Contrary to what we hear all too often, there is no evidence that “the French” or “young people” “no longer want to work”. More of them than ever before are doing so (see Chart 16).


This transformation of work would be decisive for two reasons :
Firstly, it would allow us to increase our potential growth rate and, consequently to raise purchasing power in the long term without a worsening of public debt – whereas up to now we have sacrificed the latter in order to somewhat artificially ensure the former. From a current trend estimated at around 1% per year, this potential growth could be increased to 1.5% over the next few years. Secondly, the transformation of work would enable us to overcome the current French “dual burden” of significant recruitment difficulties and a persistently high unemployment rate of well above the 5% of near full employment achieved by most of our European neighbours. This paradox, which is economically and even more socially unsustainable, can be illustrated by the following two figures: 350,000 unfilled jobs, even though France still counts 2.2 million unemployed, among which 600,000 young people.
The public services transformation
The quality and efficiency of public spending is all too often the blind spot in our national debate, even though it is essential, not only to ensure the sustainability of public finances, but also to increase the overall competitiveness of French supply and the legitimacy of public services. Many of these services have been in crisis for several years, and it is difficult to attribute this solely to a lack of resources : public spending in France reached 58.1% of GDP in 2022 and is almost 9 percentage points of GDP higher than the average of our European neighbours who share the same social model.
This crisis may often be less a financial matter than of public service management: making its objectives legitimate again, recognition of civil servants and autonomy of their managers; performance and innovation capacity; and investment in its modernisation. Effective public service management is not necessarily easy, but it is possible.
The transformation of the Banque de France is a modest but real example; for many years we have been delivering more services, lower costs (with a drop in net operating expenses of 3.5% per year in real terms, on average since 2015), while maintaining our nationwide presence.
Some expenditure has a more favourable effect on long-term economic growth and the productive capacity. By making current and operating expenditure more efficient – this applies to the state as well as to local authorities, whose cash flow appears to be more abundant today than in 201932 – we will be able to prioritise public expenditure on the future : investment in education and skills, innovation and high value-added industries (also in relation to climate and digital transformations– see above).33
This is not only a question of economic and fiscal efficiency, but also of intergenerational justice: a debt should only be incurred by future generations if it finances expenditure for their future. And perhaps even of our national genius : in our long history, from Napoleon Bonaparte to Charles de Gaulle, public services have often been a source of unity, modernity and productivity. Advocating a transformation of public services today is a way to refuse to accept that they are outdated and set in stone.
Conclusion
⁂
Our country, even more than others in Europe, now questions its economic future: because the disease of inflation worries consumers and businesses alike; because the constant emergency over the past three years has been to deal with anxiety-provoking crises – from Covid to the war in Ukraine; because certain legitimate debates in a democracy have become so polarised as to overshadow the possibility of, and the need for, a more encompassing “narrative”.
This Letter is an invitation to move beyond the pressure of urgency, with two reasons for hope :
- France and Europe will defeat inflation, which we will bring down towards 2% by end-2024 to end-2025;
- In order to ensure price stability in the long term, but more broadly to successfully exit from the crises, our country can and must adopt a comprehensive, fair, and enduring economic transformation strategy.
We are doubtlessly experiencing a change of era, not only geopolitical, but also climatic and technological, which
calls for us to “beef up” our productive capacity.
But we have numerous strengths that enable us to adapt without undue fear, in a re-legitimised social dialogue: the strength of Europe, its currency and its prosperity; a coherent social and environmental model; our youth, who are the most numerous in Europe. And above all, our work: it must be transformed in terms of its qualifications and the way it is carried out, but it remains the key to our collective success, to our purchasing power and to full employment.
In this uncertain world, our economic destiny is largely in our hands, and minds. This conviction should be the
mainstay of our confidence.
François Villeroy de Galhau
Glossary
Employment rate
Share of the total working age population that is in work, expressed as a percentage.
Eurosystem
The European Central Bank and the national central banks of the countries that have adopted the euro.
External levy
A drain on a country’s economy due to an increase in the price of goods that the country must import.
Governing Council
Main decision-making body of the European Central Bank. It is comprised of the six members of the Executive Board and the governors of the national central banks of the euro area countries.
Harmonised Index of Consumer Prices (HICP)
A price index with a definition and methodology harmonised across the European Union, allowing for comparisons between countries.
Indexation
The automatic adjustment of a price or wage based on a given economic index.
Inflation expectations
Inflation rates expected by different categories of economic agents (households, business leaders, financial market participants) for different time horizons (1 year, 3 years, 5 years, 10 years, etc.).
Key interest rates
Interest rates set by the central bank of a country or monetary union. In the euro area, the European Central Bank sets three key interest rates: the deposit facility rate, the main refinancing operations rate, and the marginal lending facility rate.
Margin rate
A measure of the level of profitability of a company or sector. In national accounting, the ratio of gross operating surplus to value added.
Median
A value that divides a distribution into two equal parts. For example, in a distribution of wages, 50% of wages are below the median value and 50% are above it.
Minimum capital requirements
Capital requirements defined for banks by the European regulation (CRR [Capital Requirements Regulation] including notably the Basel Committee international regulatory framework), integrating individual requirements depending on the risk profile and additional requirements depending on the so-called “macroprudential” risks identified at the level of the financial system (additional reserves, also known as
“buffers” – which can be used in times of crisis).
Monetary aggregates
Measures of the amount of money in circulation. The Eurosystem monitors three aggregates, from most to least liquid :
• M1 = coins + banknotes + overnight deposits;
• M2 = M1 + deposits with an agreed maturity of up to
2 years;
• M3 = M2 + repurchase agreements, shares or units in funds
+ debt securities with a maturity not exceeding 2 years.
Neutral rate
The theoretical level of the interest rate at which monetary inflation neither accelerates nor slows.
Potential growth
The rate of growth of gross domestic product (GDP) that an economy can theoretically achieve by fully utilising its production capacity without creating inflationary pressures.
Price shield
A set of government measures aimed to protect consumers and businesses from excessive price increases, especially in energy (gas, electricity, fuel, etc.).
Purchasing power
The amount of goods and services that can be purchased with income; it therefore depends on both the level of income and the level of prices.
Real rate
The real or “economic” cost of credit (as opposed to the nominal or “financial” cost), which is calculated by deducting observed or expected inflation from the nominal interest rate.
Terminal rate
The maximum rate reached at the end of a phase of policy rate hikes by the central bank.
Underlying inflation
A measure of inflation that provides a fundamental trend in price developments. It reflects the deep evolution in production costs and the match between supply and demand. Underlying inflation is therefore more appropriate for analysing inflationary pressures, as it is less affected by exogenous factors.
Venture capital
Financing the creation or development of a risky but high potential business.
Consult the footnotes
1 “How can we reduce inflation?”, Letter to the President of the Republic, July 2022.
2 Otherwise known as core inflation.
3 Bignon (V.) and Gautier (E.) (2022), “French households and inflation in 2022”, Banque de France Bulletin, No.243/1, November. Preliminary results of the CSA-Banque de France survey, March 2023.
4 Lévy (R.-G.) (1919), “La vie chère : causes et remèdes”, Revue des Deux Mondes, 6th period, 52-3, August.
5 Bénassy-Quéré (A.) (2022), “Unfair inflation”, Article, French Treasury, 6 September.
6European Commission, Consumer Survey (framework of the European Harmonised System of Business and Consumer Surveys), Q4 2022.
7 INSEE, Monthly consumer confidence survey (Camme), 1986-2023 period.
8 Baudry (L.), Gautier (E.) and Tarrieu (S.) (2023), “Les négociations de salaire dans le contexte de hausse de l’inflation”, Banque de France Bulletin, No. 245/6, March-April (forthcoming translation).
9 Dares (2023), “Évolution des salaires de base dans le secteur privé – Résultats définitifs du 4e trimestre 2022”, Dares Indicateurs, No. 20, March.
10 Banque de France (2023), Macroeconomic Projections France – 2023-2025, March.
11 We take the 2018 level as a benchmark for the pre-Covid period as 2019 was impacted by the double-counting of the crédit d’impôt pour la compétitivité et l’emploi (CICE – tax credit for competitiveness and employment).
12 Arce (O.), Hahn (E.) and Koester (G.) (2023), “How tit-for-tat inflation can make everyone poorer”, The ECB blog, 30 March.
13 European Commission, Standard Eurobarometer 98.
14 Governing Council of the European Central Bank, press release, 16 March 2023.
15 Annual change in the broadest measure of the money supply (M3).
16 In full or more than 75% of it. See Banque de France (2023), “Quarterly survey on the access to bank financing of companies in France – 4th quarter 2022“, Stat Info, February.
17 Doh (T.) and Foerster (A. T.) (2022), “Have lags in monetary policy transmission shortened?”, kcFed Economic Bulletin, Federal Reserve Bank of Kansas City, December.
18 Bailey (A.) (2023), “Supply matters”, speech, 27 March.
19 “How can we reduce inflation?”, Letter to the President of the Republic, July 2022.
20 European Commission (2020), “Fit for 55 impact assessment”, Commission Staff Working Document, No.SWD(2020) 176 final, September.
21 Pisani-Ferry (J.) and Mahfouz (S.) (2022), “L’action climatique : un enjeu macroéconomique”, La note d’analyse, No. 114, France Stratégie, November.
22 Between 2012 and 2022, the euro area displayed average excess savings of close to EUR 250 billion per year.
23 Villeroy de Galhau (F.) and Nagel (J.) (2022), “Le temps est venu d’une véritable Union des marchés de capitaux”, Les Echos, 14 November.
24 Bergeaud (A.) and Verluise (C.) (2022), “The rise of China’s technological power: the perspective from frontier technologies”, CEP discussion paper, No.1876, Center for Economic Performance, October.
25 OECD Data, Gross domestic spending on R&D: in 2020, as a percentage of GDP, European Union 2.2, United States 3.45, China 2.40, South Korea 4.81.
26 Villeroy de Galhau (F.) and Nagel (J.) (2022), art. cit.
27 Banque de France (2023), Monthly business survey, April.
28 Unédic (2023), Articulation entre assurance chômage et retraites, March.
29 Guadalupe (M.), Jaravel (X.), Philippon (Th.) and Sraer (D.) (2022), “Cap sur le capital humain pour renouer avec la croissance de la productivité”, Les notes du conseil d’analyse économique, No. 75, September.
30 Bergeaud (A.) and Cette (G.) (2021), “Teleworking: how will it affect productivity?”, Eco Notepad, post No.198, Banque de France, January.
31 Institut Montaigne (2023), Les Français au travail : dépasser les idées reçues, survey, February.
32 DGFiP (2023), Situation mensuelle comptable des collectivités locales. Situation 2022 au 28 février 2023, No. 5, March.
33 See also Cour des comptes, Une stratégie de finances publiques pour la sortie de crise (June 2021) and La situation et les perspectives des finances publiques (July 2022).
Updated on the 25th of July 2024