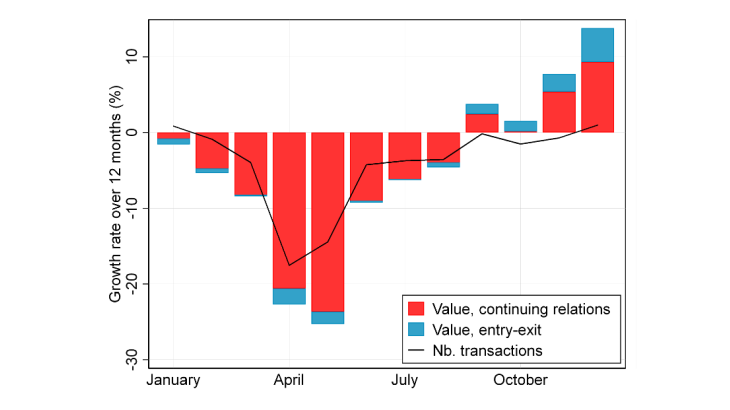
Note: Authors calculations based on data from the Trade Data Monitor (TDM) for 31 reporting countries accounting for about 75% of global trade. Exports are measured in current USD. A trade relation is represented by an exporting country, an importing country and a product detailed at the 6-digit level of the Harmonized System of the product nomenclature of the United Nations. A “Continuing relation” corresponds to a trade relation that remains “active” (i.e. is represented by a positive value of trade) in a given month in two consecutive years (e.g. April 2019 and April 2020). The value of entry minus exit corresponds to the change in total bilateral exports, which is explained by new trade relations being created over twelve months, and trade relations being terminated. A positive value implies net trade creation, while a negative value implies net trade destruction. Based on Berthou and Stumpner (2021).
The chart shows that the global trade value plummeted in the spring of 2020, at the time when many countries introduced lockdowns and other restrictions connected to Covid-19. In April and May 2020 in particular, the total value of exports declined by about 25% compared with the same month in the previous year. This is due to a smaller amount of exports within continuing trade relations (exporting country, importing country and detailed product), and also, to a lesser extent, due to a decline in the number of transactions (number of foreign trade partners and products exported).
The recovery in global exports started in June 2020 and exports had already recovered to pre-crisis levels in September 2020. Strikingly, the recovery continued in the fall of 2020 at a rapid pace, despite new lockdowns being introduced in Europe during the second wave of the pandemic.
Exports plummeted more in countries with stricter lockdowns
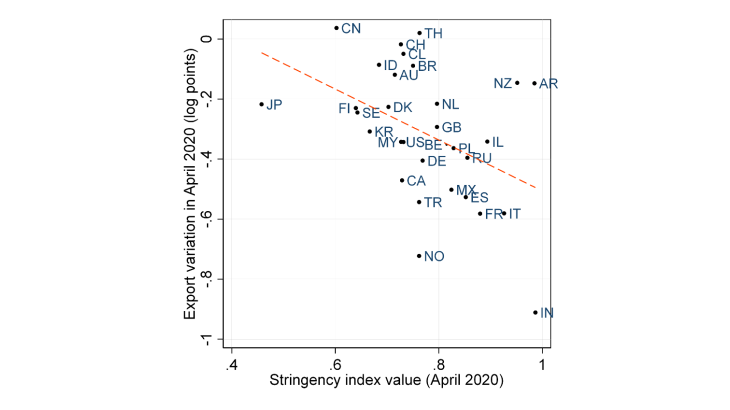
The decline in country-level exports during the first wave of the pandemic is closely related to the stringency of the restrictions implemented by governments.
This finding is based on Chart 3 where data on export growth by country between April 2020 and April 2019 and data on lockdown stringency by country in April 2020 are combined. Lockdown stringency accounts for all restrictions that were implemented by governments, including workplace closures, school closures, restrictions on gathering or restaurants, shops closures, or restrictions on transportation and international travel. Chart 3 shows that countries that implemented stricter restrictions in April 2020 experienced a larger decline in their exports.
In a country like France where these restrictions were particularly severe in the spring of 2020, a very sharp drop in the value of exports compared with the previous year is observed. In countries where fewer restrictions were introduced, either because of a different management of the pandemic (Sweden) or because of a less severe pandemic wave (Japan), aggregate exports declined much less.
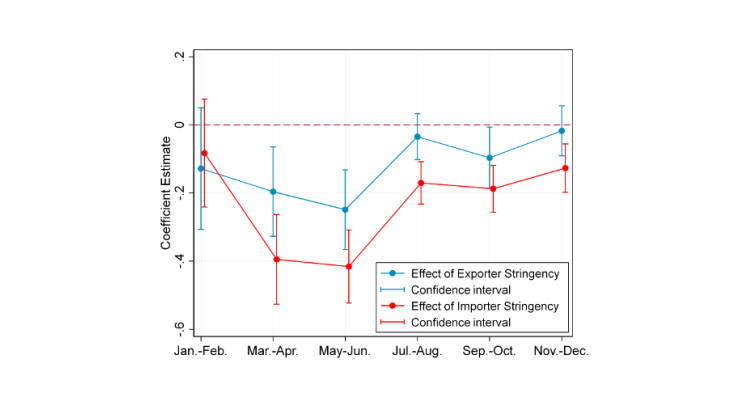
In a more detailed analysis, Berthou and Stumpner, (Banque de France mimeo, 2021) quantitatively assess the effect of restrictions’ stringency on both exports and imports, using bilateral trade data detailed at the product-level. Their estimations confirm that the value of bilateral trade between countries declined more when restrictions were implemented with a higher degree of stringency. This conclusion remains valid even when additional controls are introduced in the estimation, for example to account for cross-country differences in the dynamics of the pandemic, which could have affected exports and imports on top of the severity of the restrictions implemented by governments.


