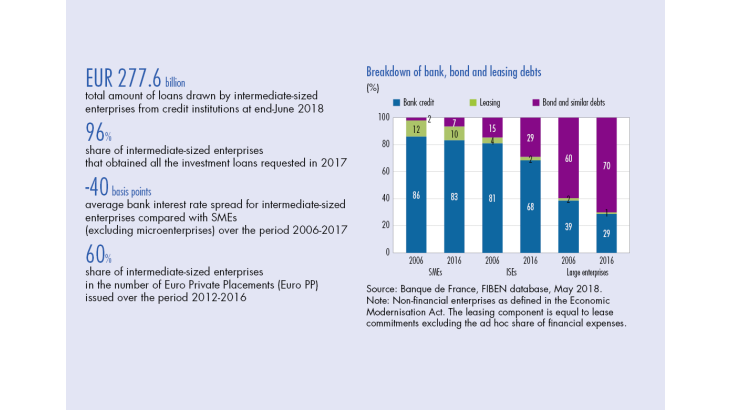
Existing studies, in particular those of INSEE, provide a fairly fine description of the characteristics of intermediate-sized enterprises (ISEs) and their weight in the French economy (see Appendix 1 for a summary). The objective of this study is to complete this presentation by focusing on the more specific issue of funding.
Unless otherwise stated, company sizes are defined according to the 2008 Economic Modernisation Act. The construction of the different categories of enterprises is explained in Appendix 2. It should be noted that ISEs do not belong to the category of small and medium-sized enterprises (SMEs). They employ less than 5,000 people and have an annual turnover of less than EUR 1.5 billion or a balance sheet total of less than EUR 2 billion. Furthermore, within the framework of the Economic Modernisation Act, they may be composed of one or more legal units organised into groups. According to INSEE, there were close to 5,800 ISEs in France in 2015 (see Appendix 1).
1. Intermediate-sized enterprises’ main sources of financing
Equity financing is increasing
How do intermediate-sized enterprises finance themselves? To answer this question, a first approach consists in analysing the liabilities side of ISEs’ balance sheets, which at any given time list all of their sources of financing. Table 1 thus presents the aggregate liability structure of all ISEs recorded in the FIBEN database, with a distinction made between equity and debt.
In practice, the construction of such a table requires making ad hoc assumptions to classify certain liabilities in one category rather than another. The results should therefore be interpreted with caution. Table 1 shows the changes in the liability structure of intermediate- sized enterprises between 2006, i.e. before the crisis, and 2016. It also compares ISEs with SMEs and large companies.
What are the main trends? First, the weight of equity in ISEs’ total liabilities has increased. It rose from 36% in 2006 to 39% in 2016 (up 3 percentage points). The increase is more marked for SMEs (up 7 percentage points) and SMEs and ISEs have converged towards large companies’capital structure, with the weight of equity being identical for all company sizes in 2016.
[To read more, please download the article]
