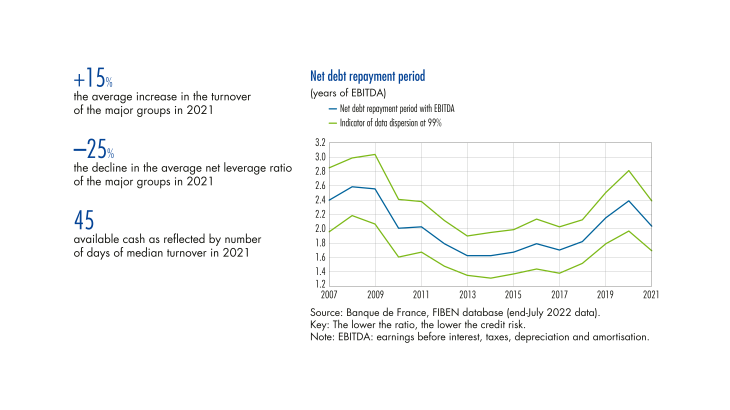
This article analyses the economic and financial position of the major French non-financial groups, as reflected by their balance sheets in 2021, using the consolidated accounts in the Banque de France’s FIBEN company database (see Appendix 2). The study covers a total of 214 major groups.
1 Activity and earnings recovered after the severe impact of the health crisis in 2020
The rise in the activity of the major groups has led to an increase in their value added
In 2021, the value added (VA) of the major groups grew by an average of 15.4% year-on-year, while GDP in France rose by only 8.2% at current prices (6.8% at constant prices) – see Chart 1a. The activity of the major French groups therefore grew at a much faster rate than the French economy as a whole, and even faster than the world economy. In 2020, the activity of the major groups declined at almost the same rate as the French economy.
As measured by the turnover, activity rose at an equivalent rate, i.e. 15.1% on average (see Chart 1b). For over half of the major groups, it increased by more than 12.1%.
Turnover grew by more than 10% in most sectors. It even reached 19.1% for the major French industrial groups, driven by the energy industry. Turnover growth was lower in trade (7.8%), while in the accommodation and food services sector, which was particularly badly hit by the health restrictions, it fell by 4.3% (see Appendix 3 for figures by sector of activity).
The share of turnover of the major groups generated abroad remained stable and at historically high levels, i.e. 63.4% of total average turnover (see Chart 2). In 2021, the general economic recovery in all markets thus benefited all the affiliates of the major groups in all their geographical areas.
Higher activity was accompanied by a recovery in EBITDA and recurring net income
In 2021, all interim operating results improved, including value added, EBITDA, EBIT and recurring net income (see Chart 3a). The rise in turnover therefore had an impact at all levels of the income statement: operating, financial and net income.
Chart 3b identifies the main components, in relation to the level of turnover, that have affected net income.(…)
[to read more, please download the article]
