Eco Notepad

Consumption since the Covid crisis: a clear divergence between value and volume trends

Published on the 29th of January 2025
Authors : Mélanie Coueffé

Post No. 384.In recent years, the French economy has suffered a number of shocks that have impacted household consumption, including the health crisis, the invasion of Ukraine and the ensuing energy crisis.

These shocks have led to sharp but uneven price increases, with differing effects across different consumption items. For certain items, there has been a clear divergence between value and volume trends, revealing substitution effects within household consumption, from goods to services, as a result of the lower increase in service prices.

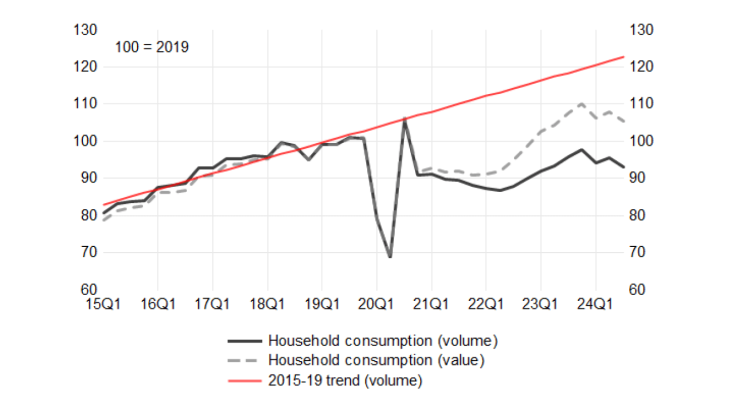
Chart 1: Household consumption in value and volume terms (100 = Q4 2019)

Image 384_Consumption-since-the-Covid-crisis-1
Source: INSEE (Quarterly national accounts), Banque de France calculations

Household consumption was severely impacted by the Covid-19 crisis and the invasion of Ukraine. These shocks were followed by price rises of varying intensity depending on the product, resulting in a change in the relative price structure and in consumer behaviour. In this post, we analyse two measures of consumption: spending in terms of value in current euros, and spending in terms of volume, adjusted for price increases and therefore directly reflecting quantities consumed.

After falling sharply in 2020 and 2021, consumption in volume terms has returned to its pre-Covid level, and even exceeded this by almost 3% in Q3 2024. Nevertheless, this growth remains almost 4% below the trend calculated over the 2015-19 period (Chart 1).

In value terms, while the rate of increase was only slightly higher than it was before the crisis in volume terms, it has been much higher since 2022. There has been a sharp 21% rise in consumption in value terms since 2019, reflecting the sharp price increase. 

These shocks have affected the structure of consumption by product. In volume terms, consumption of goods fell by 4% between 2019 and 2024, while consumption of services rose by 11%. In value terms, household consumption of goods grew by 15%, while consumption of services grew by even more (up 27%). Within goods and services, we can highlight several product categories.
 

For certain products, the increase in consumption in value terms has been accompanied by a fall in consumption in volume terms 

When compared with the trend for the 2015-19 period, the consumption of some products in value terms has risen, while consumption in volume terms has fallen. Examples include food products, energy products, other industrial goods, trade services and transport services (Chart 2). Price increases for these products led to a drop in consumption in volume terms, with a price elasticity of less than one.

The fall in food and energy consumption resulting from the sharp price rises for these goods has been documented by INSEE. In its October 2023 Economic Outlook, INSEE questioned households about changes in their consumption habits as a result of inflation. Nearly three quarters of households said they had altered their consumption habits. Home energy expenditure was the item for which most households had altered their habits (51%), followed by food (47%). In the case of food, this drop in consumption volume may reflect actual reductions in quantities consumed, but also changes in the quality of products purchased (more recourse to lower-cost products (INSEE (2023 [in French])).  Moreover, not all households have been equally exposed to price hikes as the structure of consumption differs between household categories (INSEE (2023)). Inflation has been higher for more elderly households, for those living in rural areas or small towns, and for lower income households.
 

Chart 2: Household consumption by product in value and volume terms (100 = Q4 2019)
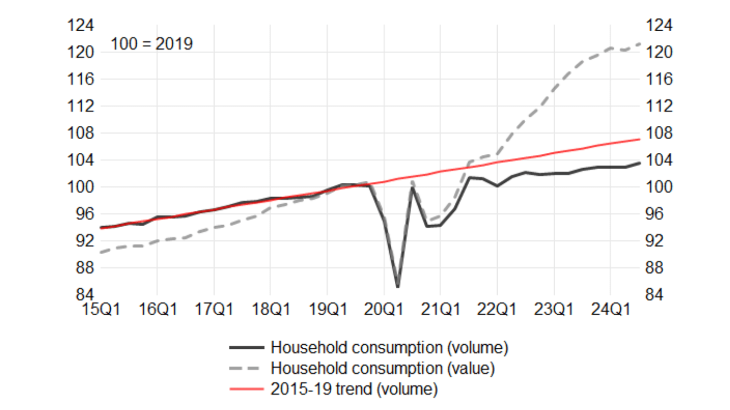
Image 384_Consumption-since-the-Covid-crisis-2
Source: INSEE (Quarterly national accounts), Banque de France calculations

For other products, price increases have had little impact on volumes 

For accommodation and food services, financial services, property services, business services and household services, consumption in volume terms has remained close to pre-Covid trends, while consumption in value terms has increased (Chart 3).

The volume of household consumption of accommodation and food services, which had plunged during the health crisis, has returned to pre-crisis levels. The volume of financial services consumed has continued to grow at the same rate, despite the sharp rise in prices (which in the case of banking services are generally measured by the margin on deposits and consumer credit relative to the money market interest rate).

Chart 3: Household consumption by product in value and volume terms (100 = Q4 2019)
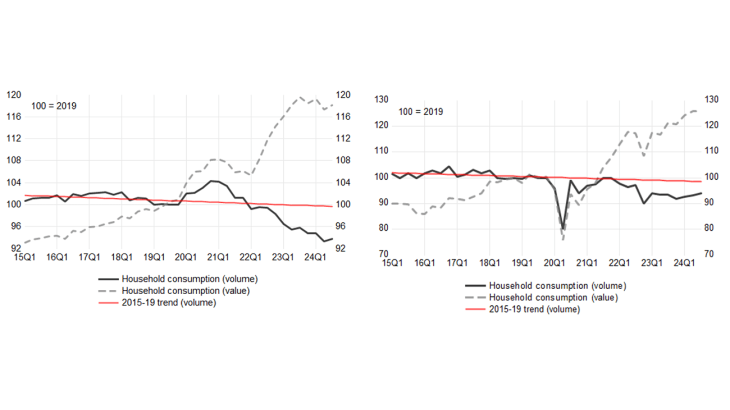
Image 384_Consumption-since-the-Covid-crisis-3
Source: INSEE (Quarterly national accounts), Banque de France calculations

Consumption of transport equipment in both volume and value terms is below its pre-Covid trend

The consumption of transport equipment remains below its pre-Covid trend, in both volume and value terms (Chart 4). For this item, either its price elasticity is very high, or there has been a negative demand shock in addition to price increases. This second, more structural explanation is likely, particularly in the case of cars: households may have adopted a wait-and-see attitude due to technological changes taking place in the sector (development of electric cars). However, this sharp drop has not affected sales of bicycles and motorbikes, which have held up well over the last three years.

Chart 4: Household consumption of transport equipment in value and volume terms (100 = Q4 2019)
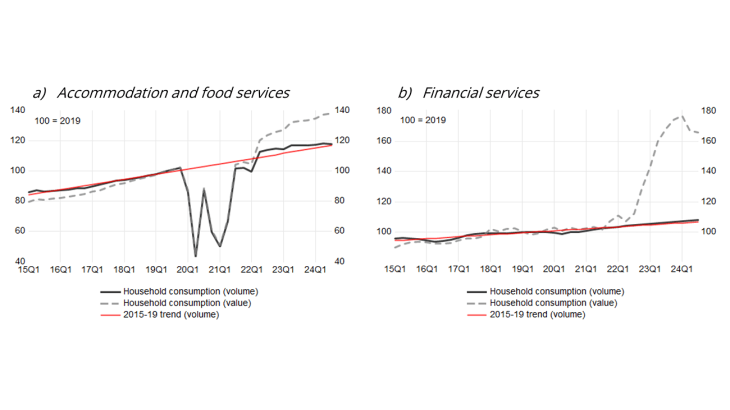
Image 384_Consumption-since-the-Covid-crisis-4
Source: INSEE (Quarterly national accounts), Banque de France calculations

The change in the structure of consumption since 2019 is therefore slightly different in value versus volume terms

The share of goods in total consumption has fallen by slightly less in value terms (down 2.3 pp, to 43.2%) than in volume terms (down 3.3 pp, to 42.1%), reflecting the fact that prices of goods rose faster than those of services. Households have tried to maintain the share of their budget spent on food despite the price rises. Energy as a proportion of total consumption has increased in value terms as this item has been subject to very high inflation despite the fact that volumes have fallen.

This means that services as a proportion of consumption increased by less in value (up 2.5 pp) than in volume terms (up 3.6 pp). The proportion of consumption attributable to property services fell in value terms, but rose in volume terms, illustrating the fact that rents have risen by less than inflation on other goods and services since the crisis. Moreover, information and communication as a proportion of household consumption has increased in volume, but decreased in value terms, due to the downward trend in prices of these services since the crisis.

Updated on the 29th of January 2025