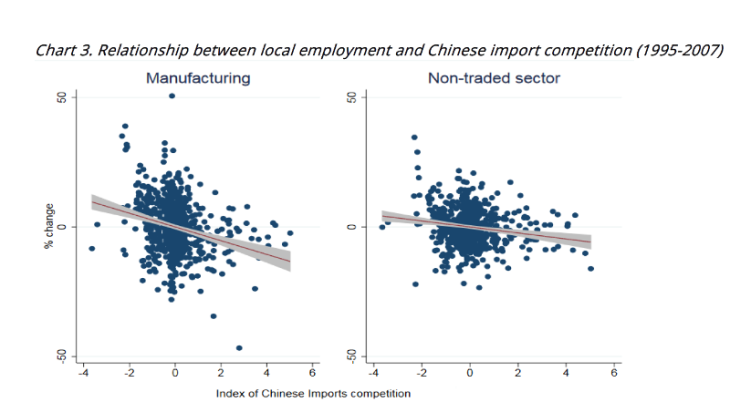
Each dot represents an employment zone for a given period (1995-2001 and 2001-2007). Variables are expressed in deviation from the period average. The non-manufacturing sector excludes public and parapublic-sector employment. Source: DADS, Comtrade, see Malgouyres (2016).
The econometric analysis confirms the negative relationship illustrated in Chart 3. A simple quantification exercise suggests that 13% of the decline in manufacturing employment in France between 2001 and 2007 is due to the surge in Chinese import competition.
The effects in regard to the non-manufacturing sector are less pronounced but nonetheless significant, suggesting the existence of substantial local multiplier effects. Indeed, the results imply that a 10% decline in manufacturing employment (full-time equivalent) caused by Chinese competition results in a 3% reduction in local non-manufacturing employment.
The negative effects differ depending on the wages
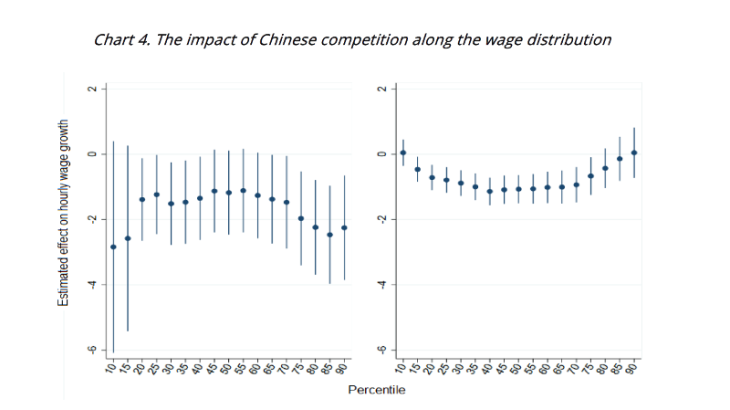
Over and above the effects on employment, Chinese competition also affects wages to differing degrees depending on their position in the wage distribution, and thus modifies wage dispersion. Chart 4 shows the estimated impact on the hourly wage for different distribution percentiles. We observe an average negative impact in both sectors.
This effect is relatively uniform along the wage distribution in the manufacturing sector. However, its estimation is imprecise at the bottom and middle of the distribution. In the non-traded sector, the shock has not significantly increased the ratio between the 9th and 1st decile – a common measure of inequalities. Nevertheless, we find that the negative impact is more pronounced on the median wage than on the top and bottom of the distribution. Compression in the lower tail of the distribution would appear to be due to the influence of the minimum wage at the bottom of the wage distribution.


