- Home
- Publications et statistiques
- Publications
- Changes in per capita property purchasin...
Changes in per capita property purchasing power in the euro area
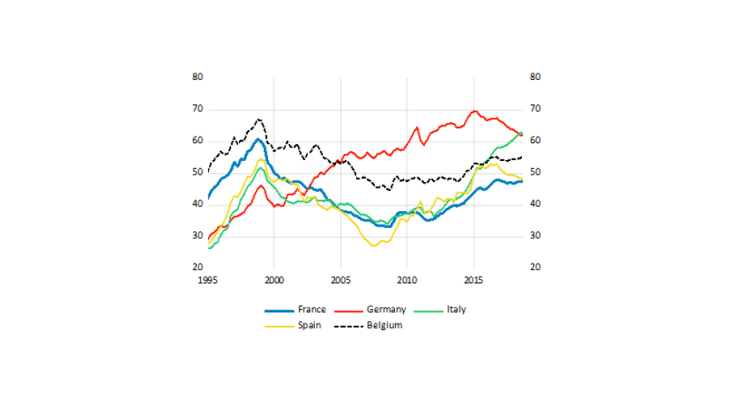
Post n°148. This post proposes a measure of property purchasing power by calculating the floor area in m² that an individual with an average income could buy with a housing loan (excluding deposits) in some of the largest euro area countries. After declining sharply in the 2000s due to rising house prices (with the notable exception of Germany), affordable floor area has increased since the 2008 crisis, mainly thanks to lower interest rates.

Sources: Authors’ calculations; Banque de France, OECD, ECB, HouseLev.
Note: Affordable floor area in France increased from 37m² in Q1 2010 to 47m² in Q4 2018 (for an individual with an average disposable income, assuming a debt-service-to-income (DSTI) ratio of one-third of disposable income and a loan maturity of 20 years).
Affordable floor area as an explicit measure of property purchasing power
Usually, the price-to-income (PTI) ratio is the preferred indicator of property purchasing power. It can be used to assess tensions in the housing market: if the PTI ratio rises, house prices then change more rapidly than household income and drive down purchasing power. However, Dujardin, Kelber and Lalliard (2015) highlighted this indicator’s limitations.
First, it does not take into account the financial conditions under which households finance their property purchase: for a given house price, property purchasing power can increase in a declining interest rate environment.
Second, the PTI ratio often relies on price indices, meaning that international comparisons are imperfect as the reference time point (the date on which the indices are deemed to be equal to 100 for all countries) reflects heterogeneous positions in the house price cycle: countries at the trough of the cycle will likely see their indices move above 100 while indices will probably fall below 100 for countries at the cycle’s peak. Thus, index comparisons are not informative with regard to the absolute level of prices.
It is possible to build up a property purchasing power indicator that can address these shortcomings by using price series expressed in euro/m² and by incorporating the interest rate associated with the housing loans granted to households (Lalliard, 2017; Bricongne, Turrini and Pontuch, 2019). This indicator represents the floor area affordable on credit (excluding deposits from buyers’ own funds) for an individual with a disposable income (i.e. after deductions and transfers) equal to the national per capita average, assuming an average loan maturity of 20 years and a debt-service-to-income (DSTI) ratio (the proportion of income spent on the main residence) at origination of one-third of disposable income.
This indicator is thus a stylised and average measure of property purchasing power, excluding deposits from buyers’ own funds. Its evolution in each country depends on changes in average per capita disposable income, average house prices and housing loan interest rates. However, this indicator notably does not take into account the dispersion of loan maturities (and the fact that they have changed over time) nor house price heterogeneity across regions and cities within the same country. It is a legible indicator, that complements PTI, but which is still simplified. In reality, borrowing practices vary across the euro area: interest rate types (fixed or floating), loan maturities and the legal regime for the collateral securing loans differ from one country to the next.
This indicator should not be interpreted as a reflection of the property purchasing power of the average household: on the one hand, it does not take into account deposits from buyers’ own funds; and on the other, the disposable income of the average household is greater than the average per capita disposable income.
Per capita property purchasing power is increasing in some of the largest euro area countries
Since the end of the 1990s, the property purchasing power indicator has followed a similar trend in some of the largest euro area countries, with the notable exception of Germany (see Chart 1):
- between 1995 and 1999, affordable floor area increased rapidly in these countries, almost doubling in Spain during the period, mainly due to the fall in interest rates and the stagnation of nominal house prices;
- with the exception of Germany, the early 2000s began a period of gradual property purchasing power decline due to an increase in house prices despite the fall in interest rates and improved income;
- since the 2008 crisis, affordable floor area has been boosted by lower interest rates and is approaching levels close to those seen in the 2000s.
Average affordable floor area in Spain and Italy has exceeded that of France since 2010. In Italy, property purchasing power increased significantly, peaking at 63m² in Q4 2018. Higher per capita income, lower borrowing costs and above all the absence of a house price rebound have bolstered property purchasing power. In Spain, the dynamic trend in average affordable floor area has lost momentum since the end of 2016, falling back to the level of France in Q4 2018. In France and Belgium, current purchasing power levels are slightly below the high of the late 1990s but are close to those of 1996-97, with affordable floor areas of 48m² and 55m², respectively, in Q4 2018.
The exception is Germany, where property purchasing power has increased almost continuously since 1995. While 31m² could be purchased with an average per capita income in 1995, less than in France or Belgium, affordable floor area rose to more than 69m² in 2015. Since then, affordable floor area in Germany has dropped back slightly, down 8m² over the 2015-18 period.
However, these comparisons do not take into account the effect of countries’ demographic structure: a younger population would have a lower average income and therefore weaker property purchasing power.
Property purchasing power buoyed by lower lending rates since 2008
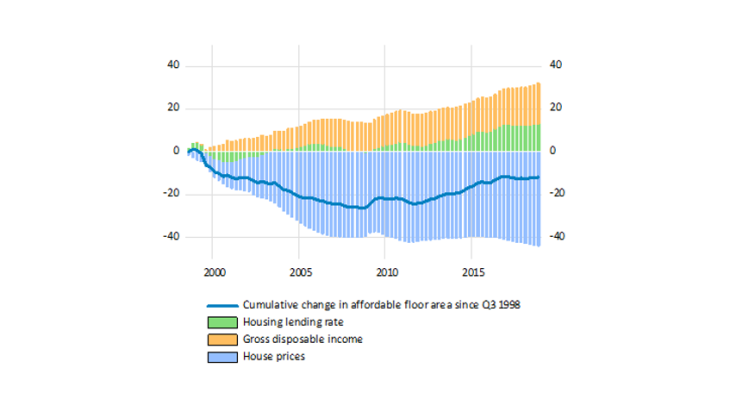
In France, house prices grew strongly from 2000 to 2007, but the trend was more uneven in the 2010s. The majority of their negative cumulative contribution of almost 40m² since 2007 (see Chart 2) was therefore felt in the initial period. It was partly offset by the increase in disposable income and then, particularly from 2008 onwards, by the fall in lending rates, whose cumulative contribution went from 1m² at the start of 2009 to 13m² at the end of 2018. Again, it should be noted that the effect of extending loan maturities is not taken into account as they are assumed to be fixed.
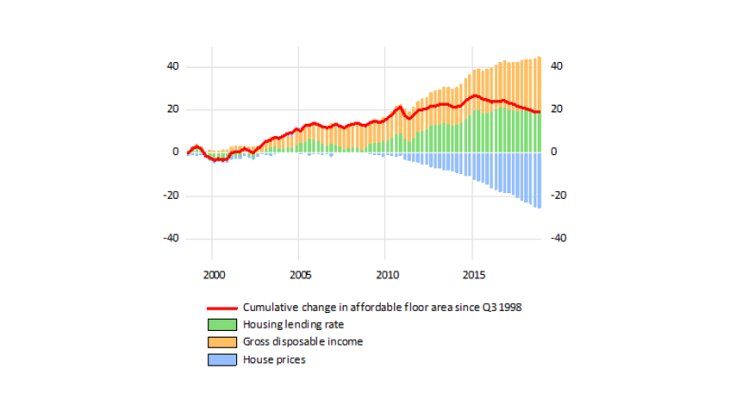
In Germany, the stability of house prices in the 2000s combined with increased disposable income bolstered household property purchasing power. Growth in house prices regained momentum from 2010 onwards, initially offset by the fall in lending rates, which continued to maintain the affordable floor area, with a cumulative contribution that amounted to 20m² in 2015. Since that date, the positive contribution of lending rates has no longer been able to offset the increase in house prices, leading to a slight erosion in property purchasing power since 2015.
Thus, the floor area that an individual could afford in Germany benefited from the later rise in house prices than in France. Disposable income grew steadily during the period under review. Lastly, the fall in lending rates since 2008 provided substantial support to property purchasing power during the past decade.

Sources: Authors’ calculations; Banque de France, OECD and ECB.
Note: This chart shows the cumulative variation in property purchasing power since 1998 and its breakdown according to the relative cumulative effects of changes in disposable income, the lending rate and house prices. The affordable floor area in France was 20m² lower at end-2004 than at end-1998, with a negative cumulative contribution of 32m² from house prices and positive contributions of 10m² and 2m² from disposable income and lending rates, respectively.

Sources: Authors’ calculations; Banque de France, OECD and ECB. Note: cf. Chart 2a.
Updated on the 25th of July 2024