- Home
- Publications et statistiques
- Publications
- Biodiversity loss and financial stabilit...
Biodiversity loss and financial stability
Post n°248. Like climate change, biodiversity loss could be a source of financial risk. As a first analysis, we study the dependencies of the securities portfolio held by French financial institutions on ecosystem services, and the impacts on biodiversity of the activities financed.
Loss of biodiversity: a new frontier for central banks
Biodiversity is the variability of living organisms and the ecological complexes of which they are part. There are three levels of biodiversity: ecosystem diversity, species diversity and diversity within species. The Intergovernmental Science-Policy Platform on Biodiversity and Ecosystem Services (IPBES) has been warning policymakers of its collapse (IPBES, 2019): the global rate of species extinction is now tens to hundreds of times higher than the average rate over the past 10 million years. This could affect terrestrial biogeochemical processes in a non-linear and irreversible manner. Human activities are causing a decline in biodiversity through five main drivers of change: land and sea use change, unsustainable exploitation of organisms, climate change, pollution and invasive alien species.
Healthy ecosystems provide "ecosystem services" (material and water supply, climate regulation, pollination, etc.) on which economic activities depend. Their alteration could disrupt economic activities with potential consequences for financial stability. For this reason, central banks and supervisors (van Toor et al., 2020; NGFS and INSPIRE, 2021; Salin et al., 2021) are taking an increasing interest in the financial risks associated with biodiversity loss (physical risk) as well as those potentially generated by the incompatibility of business strategies and models with economic and regulatory changes aimed at protecting biodiversity (transition risk). This post presents an initial analysis of the French financial system's exposure to these risks (Svartzman et al., 2021).
Dependency and impact analysis to assess exposure to biodiversity-related risks
Based on the work of the Dutch Central Bank (van Toor et al., 2020), we first assess the dependencies on ecosystem services, via business activities represented in the securities portfolio (equities and bonds), of French financial institutions (mostly investment funds, insurance companies and banks). This provides us with an initial estimate of the potential exposure to the physical risk of biodiversity loss: in the event of a deterioration in the quality of a given ecosystem service ("physical shock"), a company that is highly dependent on this service will be more likely to be disrupted in its operations. To assess these dependencies, we use the ENCORE database developed by the Natural Capital Finance Alliance and UNEP-WCMC. This database indicates the level of dependency (from very low to very high) of 86 production processes on 21 ecosystem services. Each company in the portfolio is then attributed a level of dependency based on the production processes used.
We then look at the impact (or "footprint") on terrestrial biodiversity of the activities conducted by the companies whose securities these financial institutions hold. This enables us to estimate the exposure of the securities portfolio of French financial institutions to potential transition risk. Indeed, the more negative the impact on biodiversity of the companies in the portfolio, the higher the risk of being subject to regulations or a change in consumer preferences ("transition shock"). In order to assess the biodiversity footprint of companies and then of the portfolio, we use the Global Biodiversity Score (GBS) developed by CDC Biodiversité and its application as a database developed by Carbon4Finance. This tool converts a company's turnover by region and production sector into pressures on biodiversity (in terms of climate change or land use, for example), then into an impact expressed in a single metric, the MSA.km². An impact of 1 MSA.km² can be interpreted as having the same effect on biodiversity as transforming 1km² of "intact" ecosystem (undamaged by human activities) into an entirely man-made surface (e.g. a parking lot).
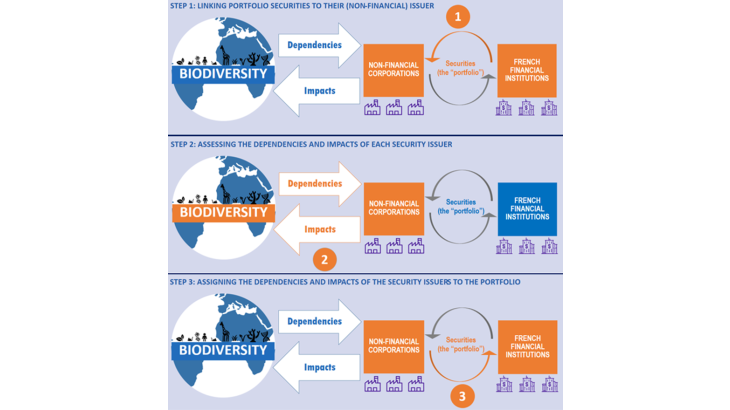
Finally, the portfolio of financial institutions is attributed a share of the impacts and dependencies of the companies whose securities it holds (Chart 2).
Results - Portfolio dependencies and impacts
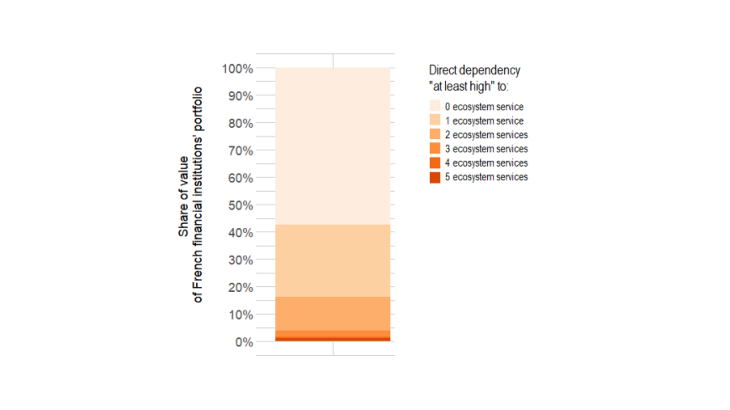
As regards ecosystem service dependencies, we find that 42% of the value of the securities portfolio held by French financial institutions corresponds to securities issued by companies that are highly or very highly dependent on at least one ecosystem service (Chart 1). 9% is issued by companies that are very highly dependent on at least one ecosystem service, and 21% is issued by companies that combine at least a "medium" dependency on 5 or more ecosystem services.
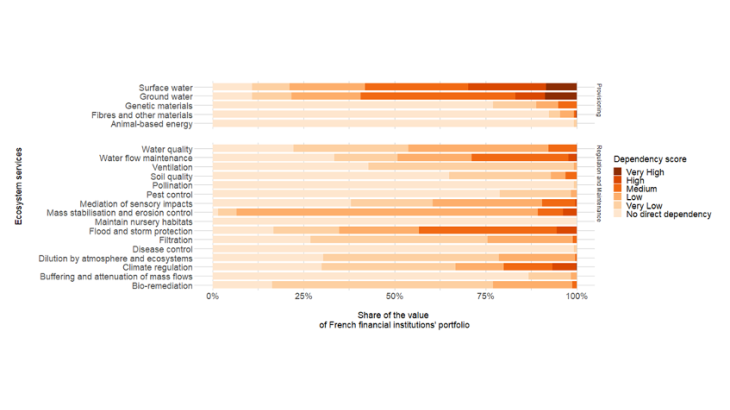
Companies are particularly dependent on the ecosystem services related to water supply (surface and groundwater) but also on certain regulatory services (erosion control, protection against floods, climate regulation) (Chart 3).
It should be noted that these dependencies are only "direct": they only concern the dependencies on ecosystem services of the production activity of the company itself, and not that of its suppliers. By integrating the dependencies of suppliers along the upstream value chain, we obtain the result that all companies in the portfolio become at least slightly dependent on all ecosystem services (the "No dependency" category disappears).
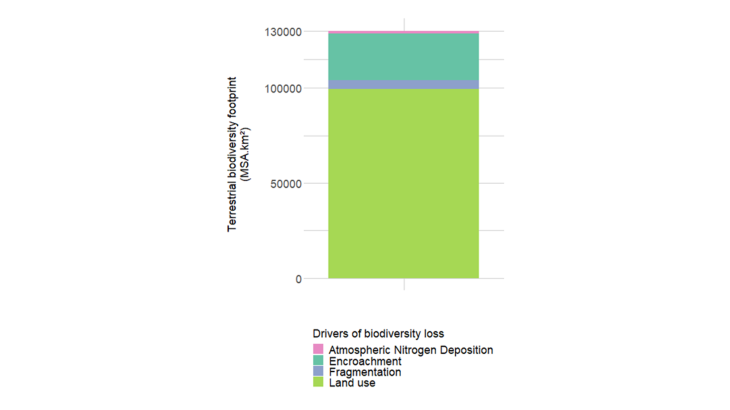
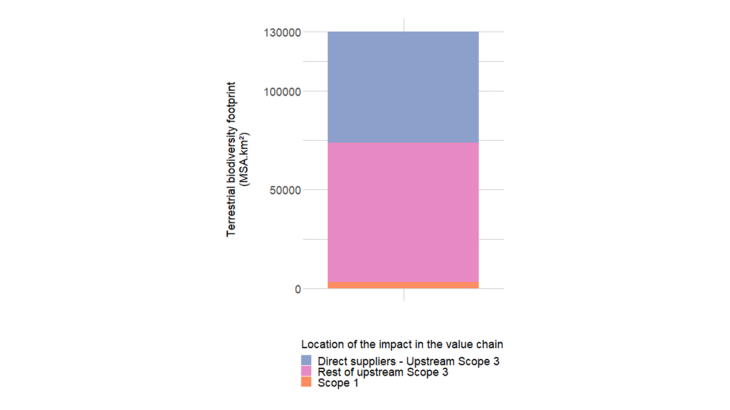
As regards the impacts on terrestrial biodiversity, we obtain a portfolio footprint of 130,000 MSA.km². This can be compared to the effect on terrestrial biodiversity of the artificialisation of 130,000km² (equivalent to 24% of the surface of metropolitan France) of an initially "intact" ecosystem. This so-called static footprint describes the stock of cumulative impacts over time (for example, offices or parking lots built over the years) as opposed to the annual flow of new impacts (for example, parking lots built this year), described by the dynamic footprint not presented here.
Impacts are primarily exerted by the companies' suppliers (referred to as "upstream scope 3") rather than by the production operations performed by the companies themselves ("scope 1") (Chart 4, right). They can mainly be explained by changes in land use (Chart 4, left)
Finally, this footprint can mostly be explained by the securities issued by companies operating in the chemicals, dairy and beverage manufacturing, and gas production and distribution sectors.
This work provided an approximation of the exposure to potential shocks related to biodiversity loss, but further analysis needs to be conducted to better understand their transmission channels and their impacts on companies and financial institutions.
Updated on the 25th of July 2024