Eco Notepad

The 2009 and 2020 crises: diverging external balance trajectories

Published on 2 July 2021
Authors : Pierre Sicsic

Post n°222. The increase in the French fiscal deficit in 2020 was greater than in 2009 and accompanied by a deterioration in the external deficit. Accordingly, the nation's financing requirements (for households, companies and government) increased in 2020, unlike in 2009, with the financing requirements of financial and non-financial corporations increasing.

Image Net lending by sector (in percentage points of GDP)
Chart 1: Net lending by sector (in percentage points of GDP)
Source: INSEE annual national accounts
Note: “Companies” refers to financial and non-financial corporations.

Income trends in 2009 and 2020: a contrasting picture

In a recent INSEE post, Carnot showed that national income fell by more than EUR 150 billion in 2020, while consumption and investment (all institutional sectors combined) fell by around EUR 70 billion and EUR 45 billion, respectively, while the external deficit increased by around EUR 40 billion. As spending fell less than income in 2020, there was external borrowing. 

The changes in income seen in 2009 and 2020 were quite different. In both cases, it was general government income that fell the most (by EUR 53 billion and EUR 111 billion, respectively). Corporate income fell slightly in 2009 (EUR 7 billion), but more significantly (EUR 59 billion) in 2020. Lastly, household income, which almost stagnated in 2009, rose slightly in 2020 (changes of EUR 2 billion and EUR 15 billion, respectively).

Interestingly, there were divergences in the trend of aggregate household income in 2020 in the main euro area countries (Table 1). Nominal household income rose slightly in France and Germany, while it fell in Italy and Spain in an environment where national income contracted more markedly.

Table 1: Change in nominal gross disposable income in 2020 (%) Source: Ameco
  Germany France Italy Spain
National income -3,4 -6,0 -7,8 -9,8
Households 0,9 1,1 -2,8 -3,3
Excluding households -10,4 -18,1 -17,7 -20,5

This preservation of household income in France was counterbalanced by a deterioration not only in the fiscal deficit (as in other European economies), but also in corporate income. Accompanied by a fairly high level of investment given the usual determinants (see the latest Banque de France macroeconomic projections), the increase in companies' net borrowing, which came on top of those of the general government, resulted in a deterioration in the external balance, as these increases were not offset by higher household financial savings (net lending).

This post compares the 2020 episode to the periods when the fiscal deficit and the external deficit increased, to describe its origin from a household and/or corporate savings angle.

Combined deterioration in the fiscal and external deficits in 2020, contrasting with 2009

The sharp increase in the fiscal deficit in France in 2020 enabled household income to be preserved, while the sum of incomes contracted. The difference between the sum of incomes and the sum of spending (consumption and investment) is the nation's net lending/borrowinf, which reached -2.5% of GDP in 2020 (external deficit). When not taking into account external income flows, the sum of incomes is equal to the value added produced in the country.

The nation's net lending/borrowing, which corresponds to the balance with the rest of the world, is also the sum of those of the private sector (households and companies) and general government (which is negative in the case of a fiscal deficit). When the fiscal deficit increases, the external balance deteriorates, unless the private sector's net lending improves and offsets this.

The sum of net debt flows is the "net external position", which corresponds to the nation's net financial wealth. At the end of 2019, it was in negative territory by a little over EUR 550 billion (23% of GDP). It was well below the alert threshold used in the European macroeconomic imbalance procedure (35% of GDP).

The 2009 crisis led to an increase in the private sector financing capacity identical to that of 2020, but with a very different distribution between households and companies (see Chart 2 for private net lending). As the increase in the fiscal deficit was smaller than in 2020, it was not accompanied by an external deficit. Household financial savings, at nearly 8 points of GDP, were exceptionally high in 2020 (Chart 1). In 2009, it was the increase in corporate net lending, following the decrease in investment (see above for income trends), that explained the increase in private financing capacity. This offset the public dissaving.

Past external deficits were less attributable - or not attributable at all - to the fiscal deficit
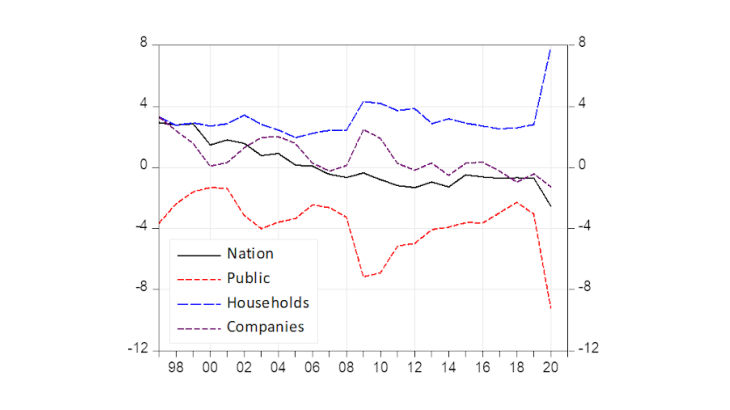
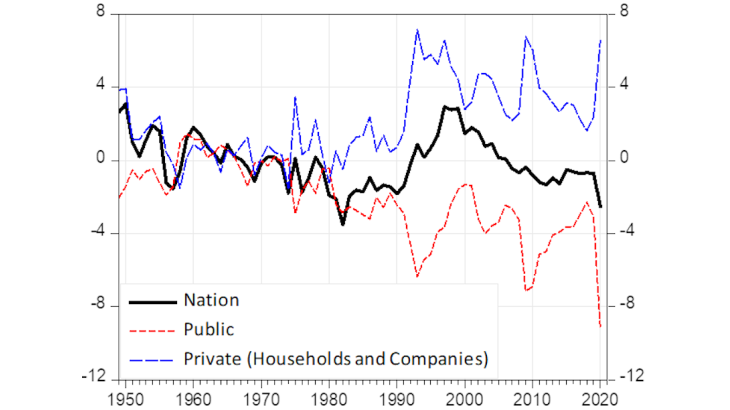
Image Net lending by sector over the long term (in percentage points of GDP)
Chart 2: Net lending by sector over the long term (in percentage points of GDP)
Source: INSEE annual national accounts - https://www.insee.fr/fr/statistiques/5354786
Note: “Companies” refers to financial and non-financial corporations.

The external deficit, measured by the nation's net borrowing, exceeded 2% of GDP from 1980 to 1983 (Chart 2, dip to -3.5% in 1982). The increase in the fiscal deficit and the decrease in private net lending (which was noticeable during the second oil shock) explained in equal measure this change in the external deficit. Going back even further, the balance-of-payments crises of 1956-57 (Chart 2 black line "Nation" drops from 1.5 to -1.5), and a slight deterioration in 1969 to -1% were not at all linked to the fiscal deficit.