Official statistics on the residential housing market are generally available with a certain delay and most are provided at aggregate level while discrepancies between urban and rural areas have been well documented in the literature (e.g. Poon and Garratt, 2012 for the UK). Getting timely information might be even more critical during crisis episodes such as the Covid-19 pandemics as the publication delays of official statistics do not allow to grasp dramatic and sudden turning points in the economic activity. In the meantime, a lot of information is available publicly and in real-time on real-estate websites, particularly on the residential segment where 92% of real-estate firms post ads on the Internet. Using these alternative data would then make it possible to construct indicators more rapidly (real-time), at higher frequency (daily), and with high granularity (at the postcode level).
Our approach focuses on the UK – but could be seamlessly extended to other countries – and consists in web-scraping the five main real-estate websites in the UK. On average, we scrap around 1.5 million offers (for sale and to rent) per day with extensive information on price, location, area, number of rooms, description, type of offers, and type of dwelling. The originality of the web-scraped data lies in getting the sellers’ perspective through the offers that they (or the real-estate agencies they mandate) post on the Internet – while much of the literature and all official statistics rely on the transactions.
This dataset first allows for a monitoring of the housing market in real-time. The selling price can be tracked daily and at a highly granular level, offering an early and finer picture of the on-going developments in the market – therefore complementing official statistics. In the same vein, usual indicators of the housing market (e.g. rent-to-price ratio) can be issued in real-time. These indicators complement official statistics by giving insights on the point of view of sellers. This is where the originality of our web-scraped dataset lies, and this peculiar standpoint allows for innovative indicators. A first example of it is the number of new offers posted each week – indicating sellers’ willingness to put their properties on the market. A second one relates to the price changes for an existing offer: daily web scraping makes it possible to track one particular offer over time and observe how the seller adjust its price. Interestingly, this gives a very early signal of the dynamics in the housing market – as this happens before any transaction can even be registered in official statistics.
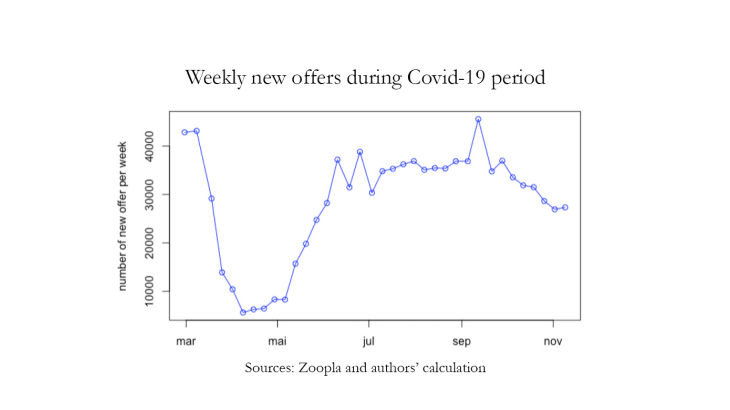
Using these indicators on a daily basis, we track the UK housing market during the Covid-19 crisis and document a clear 80% decline in the number of new offers during the first lockdown (see Figure 1) while showing that sellers refrained from moving their prices during this period, suggesting a “wait-and-see” approach. In the aftermath of the lockdown, mean selling prices started to increase at country-level. However, this hides large discrepancies across regions: while prices increased steadily in rural areas, they declined in London (with potential composition effects though) – the region that was most affected by the virus, and where evidence suggests that the housing market is the most tense.
This dataset also allows to match web-scraped data on posted ads with notarial data on transactions, making it possible to compute the difference between posted and transacted prices. This is a direct indication of the buyers’ negotiation margin in the vein of Galesi et al. (2020), which can be computed at a very granular level and tracked over time. In the particular case of the UK, this indicator shows large discrepancies across regions with buyers’ negotiation margin being lowest in London.
